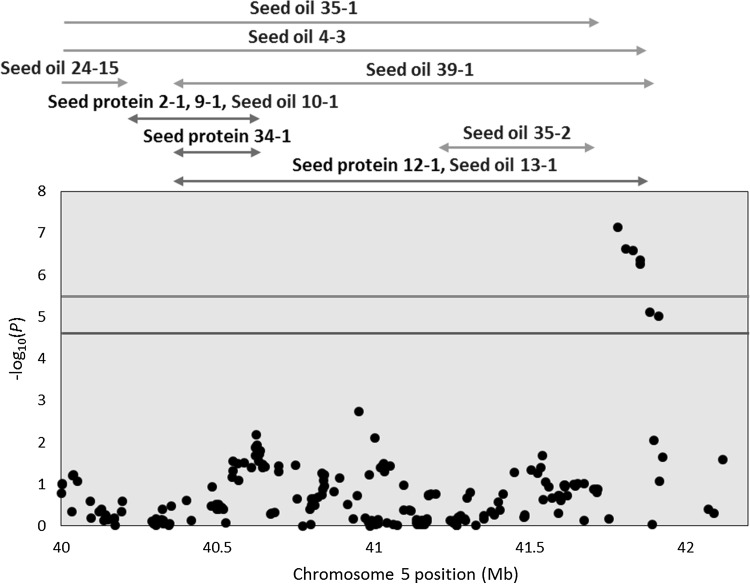
Fig. 4.
The 40–42.5 Mb region on Chr 5 covering significantly associated trait-specific SNPs identified by multi-trait mixed model. Negative log10P-values of for the Illinois 2015 environment (IL15) are plotted against physical genomic position (Glyma.Wm82.a2.v1). Horizontal lines are as described in Fig. 3. Previously identified QTL are indicated with horizontal arrows and were obtained from SoyBase (http://soybase.org)

