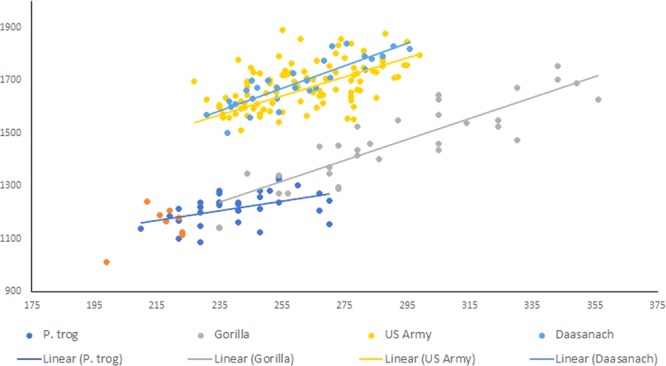
Figure 1.

Scatterplot of foot lengths and statures for bonobos (red), chimpanzees (dark blue), gorillas (gray), and modern humans (yellow – US Army sample, light blue – Daasanach sample). Linear regression fits are indicated by the solid lines corresponding to each group. Within chimpanzees, gorillas, and both modern human groups, there are statistically significant relationships between foot size and stature, suggesting that foot or footprint size dimorphism should closely track overall body size dimorphism for each of these samples. Due to the small size of the Pan paniscus sample, regression analyses were not performed for this group (see Table 2).
