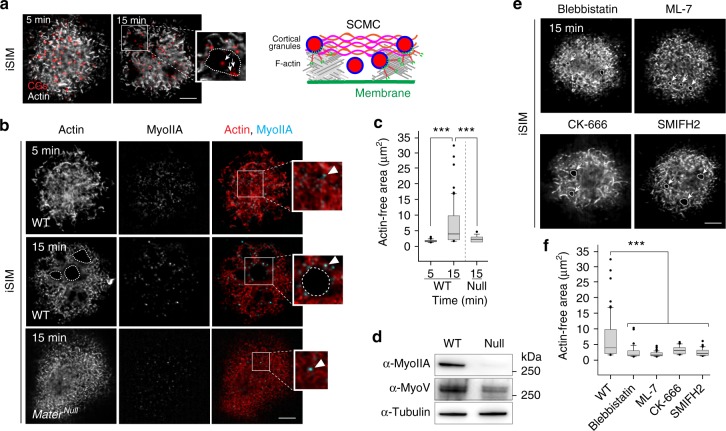
Fig. 5.
Clearance of egg cortex during cortical granule exocytosis. a Zona-free ovastacinmCherry eggs were stimulated to exocytose and fixed after 5 and 15 min followed by immunostaining with phalloidin to label F-actin. Representative iSIM maximum intensity projection of egg cortex showing cortical granules (red) and actin (gray) with magnified view of actin-free area. Arrows, cortical granule; white dashed line, actin-free area. Schematic (right) shows clearance of cortical actin during exocytosis and the appearance of cortical granules inside cleared actin sites. Scale bar, 5 μm. b Zona-free wild-type and MaterNull eggs were stimulated to exocytose and fixed after 5 and 15 min followed by immunostaining with phalloidin (red) and antibody specific to myoIIA (cyan). Representative iSIM projection of the egg cortex with magnified views of regions of interest (white insets). Arrowhead, myoIIA puncta; white dashed lines, actin-free area. Scale bar, 5 μm. c Quantification of actin-free areas in the cortex of fixed stimulated wild-type eggs after 5 (n, 20) and 15 min (n = 78), and MaterNull eggs (n = 55) acquired by iSIM. Box plot includes the mean (horizontal line) and data between the 25th and 75th percentile. Error bars indicate the 90th and 10th percentiles. ***p < 0.001 by two-tailed Student’s t-test. The experiment reflects three biologically independent replicates. d Immunoblot of egg (60) lysates isolated from wild-type or MaterNull female mice and probed with antibodies specific to myoIIA and myosin V (MyoV). Molecular mass, right. e Zona-free wild-type eggs were stimulated to exocytose in the presence of myosin II inhibitors blebbistatin and ML-7 as well as actin-nucleation inhibitors CK-666 and SMIFH2. Eggs were fixed after 15 min followed by immunostaining with phalloidin (gray). White dashed lines, actin-free area. Scale bar, 5 μm. f Quantification of actin-free areas in the cortex of wild-type eggs (n = 78) and eggs treated with blebbistatin (n = 35), ML-7 (n = 52), CK-666 (n = 44), and SMIFH2 (n = 62) acquired by iSIM. Box plot includes the mean (horizontal line) and data between the 25th and 75th percentile. Error bars indicate the 90th and 10th percentiles. ***p < 0.001 by two-tailed Student’s t-test. The experiment reflects three biologically independent replicates. Source data are provided as a Source Data file

