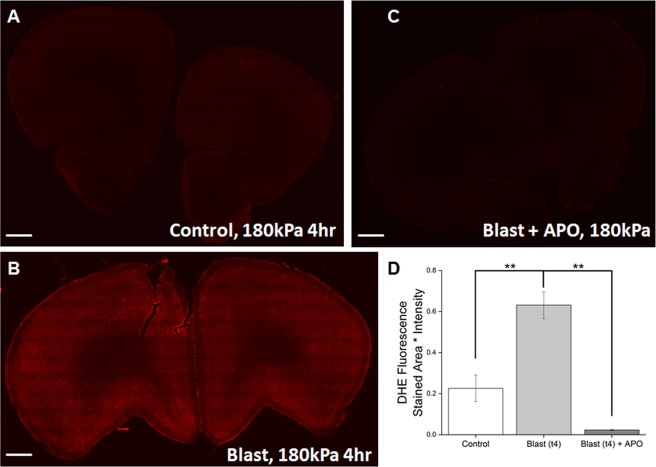
Figure 2.
DHE fluorescence in frontal cortex indicating superoxide production. (A) Low level of flurescence intensity in control tissue, basal level of superoxide. (B) Levels of superoxide robustly increase four hours following blast exposure, (C,D). Supreoxide is brought back down to basal levels with pretreatment of apocynin Quantitation of DHE fluorescence intensity for the three aforementioned groups. Scale bar = 1 mm. **Indicates a difference between control ((n = 4) and blast groups (n = 4) as well as blast + apocynin group (n = 4) with a statistical significance of p < 0.01.

