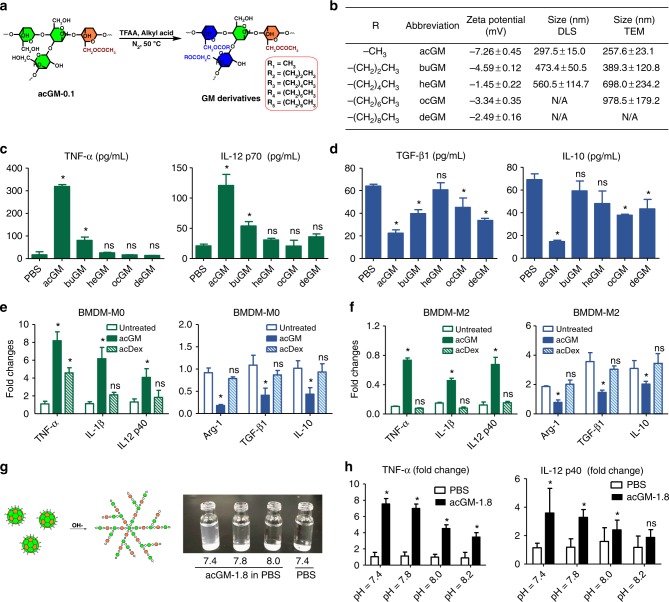
Fig. 3.
Both “ac” and “GM” are essential for the function of acGM-1.8. a Schematic illustration of preparing different GM derivatives. b Physical properties of the GM derivatives, including the type of aliphatic chain, zeta potential, and size determined by both dynamic light scattering (DLS) and transmission electron microscopy (TEM). c, d Determination of (c) proinflammatory cytokines TNF-α and IL-12 p70 and (d) anti-inflammatory cytokines TGF-β1 and IL-10 secreted by BMDM after 24 h of stimulation by various GM derivatives (*P < 0.05 vs. the PBS group; n = 3). e Fold changes of markers for macrophage polarization (M1: TNF-α, IL-1β, and IL-12 p40; M2: Arg-1, TGF-β1, and IL-10) in BMDM (BMDM-M0) treated with PBS, acGM, or acetyl dextran (acDex) for 24 h (*P < 0.05 versus the PBS group; ns: no significance; n = 3). f Fold changes of markers for macrophage polarization (M1: TNF-α, IL-1β, and IL-12 p40; M2: Arg-1, TGF-β1, and IL-10) in pre-induced M2-type BMDM (BMDM-M2) treated with PBS, acGM, or acetyl dextran (acDex) for 24 h. (*P < 0.05 vs. the PBS group; ns: no significance; the fold changes were normalized to those of M0; n = 3). g (left) Schematic illustration of breaking the acGM assemblies by alkaline solution and (right) the appearance of acGM-1.8 in PBS under different pH values (7.4, 7.8, and 8.0) compared with PBS. h Fold changes of proinflammatory cytokines (TNF-α and IL-12 p40) expressed by BMDM after incubation with PBS or acGM-1.8 under different pH values (7.4, 7.8, and 8.0; *P < 0.05 versus the PBS group; ns: no significance; n = 3). Data are representative for three independent experiments; ns: no significance

