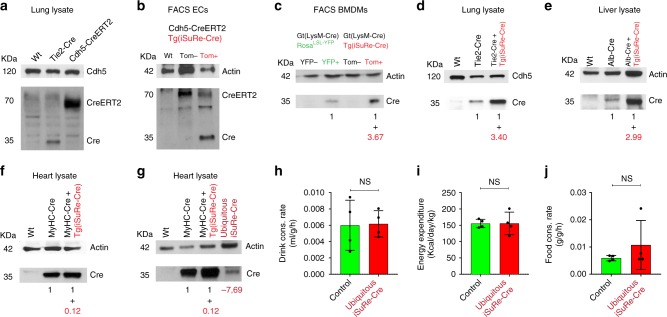
Fig. 7.
Comparison of Cre expression levels in different tissues and mouse lines. a Western blot analysis of lung lysates from mice with the indicated genotypes, showing Cre (35kDa) and CreERT2 (70 kDa) expression differences in Tie2-Cre and Cdh5-CreERT2 mouse lines. b Western blot analysis of FAC-sorted endothelial cells (CD31-APC+) from the indicated mice, showing Cre (35kDa) and CreERT2 (70 kDa) expression in wild-type, MbTomato+ and MbTomato− cells. c Western blot analysis of FAC-sorted bone marrow-derived macrophages (BMDMs) obtained from the indicated mice. d, e Western blot analysis of lung and liver lysates from mice with the indicated genotypes, showing the increase in Cre protein levels in tissues of animals with expression of the Tg(iSuRe-Cre) allele. f Western blot analysis of heart lysates from mice with the indicated genotypes, showing no significant increase in Cre protein levels in tissues of MyHC-Cre + Tg(iSuRe-Cre) animals. g Western blot analysis of heart lysates showing that animals with recombination of the Gt(Rosa)26Sor-iSuRe-Cre allele in the germline, and with ubiquitous iSuRe-Cre expression in their hearts (not only MyHC-Cre + cardiomyocytes), have significantly lower Cre levels than MyHC-Cre + hearts. h–j Metabolic studies in adult littermate mice (9 months old, n = 4 per group) having or lacking ubiquitous expression of the Gt(Rosa)26Sor-iSuRe-Cre allele. Values in red below the blots indicate the fold change in Cre protein relative to Tg(iSuRe-Cre) allele expression. Error bars indicate StDev; NS nonsignificant. Two-tailed unpaired t-test. Source data are provided as a Source Data file

