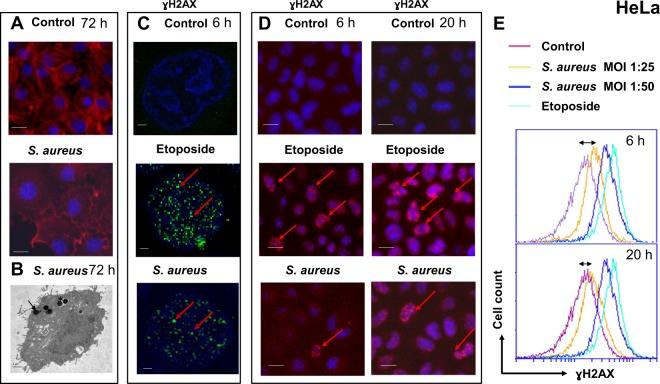
Figure 1.
Exposure to S. aureus induces DNA damage in HeLa cells. (A) HeLa cells were infected with S. aureus MW2 strain at MOI 1:50 for 2 h. After fixation with 4% PFA, followed by permeabilization in 0.1%Triton/PBS solution cells were labeled with ActinRed™ reagent (TRITC-conjugated phalloidin that labels F-actin, red staining) and nuclei were labeled with DAPI (blue staining). Samples were viewed with a Zeiss fluorescence microscope using ×100 magnification. Overlaid fluorescent images of immunostained infected vs control non-infected HeLa cells (merged) are presented. Scale bar: 10 µm. (B) Transmission electron micrographs of HeLa cell infected with MW2 strain at MOI 1:50 for 72 h. Bacteria appear to be free within the cytoplasm (arrow) or in vacuoles (asterisk). Magnification x12,000, scale bar: 1 µm. (C) HeLa cells were infected for 6 h with MW2. Cells treated with 50 µM of etoposide, which induces DNA damage, were used as a positive control After fixation and permeabilization cells were stained for γH2AX, followed by incubation with Alexa Fluor 488 labeled secondary antibody (green staining). Nuclei were labeled with DAPI (blue staining). Samples were viewed with Leica SP8 laser-scanning microscope equipped with immersion objective 63× plan Apo-NA 1.4. Single nucleus (blue) with DNA containing γH2AX (green) in contrast to the negative control non infected cells are shown. Arrows show phosphorylated H2AX. Scale bar: 1 µm. (D) High Content Screening analysis of HeLa cells infected with MW2 for 6 h and 20 h. Immunolabelling of γH2AX with the ɣ-H2AX antibody followed by the incubation with the secondary antibody coupled with Alexa Fluor 555 (red staining) in HeLa cells exposed to S. aureus compared with that of the non-infected control cells. Nuclei were stained with DAPI (blue staining). Arrows show the site of phosphorylated H2AX. Fluorescence images were obtained with a Cellomics ArrayScan VTI HCS Reader. Scale bar: 10 µm. (E) HeLa cells were infected with S. aureus with MOI 1:25 and 1:50 for 4 h and 20 h. γH2AX was quantified by flow cytometry. The data were collected from 20,000 cells and analysis was performed with Cell Quest software. Double arrow shows the shift between the non-infected control cells (violet line) and cells infected with S. aureus at MOI 1:50 (yellow line).

