Figure 1.
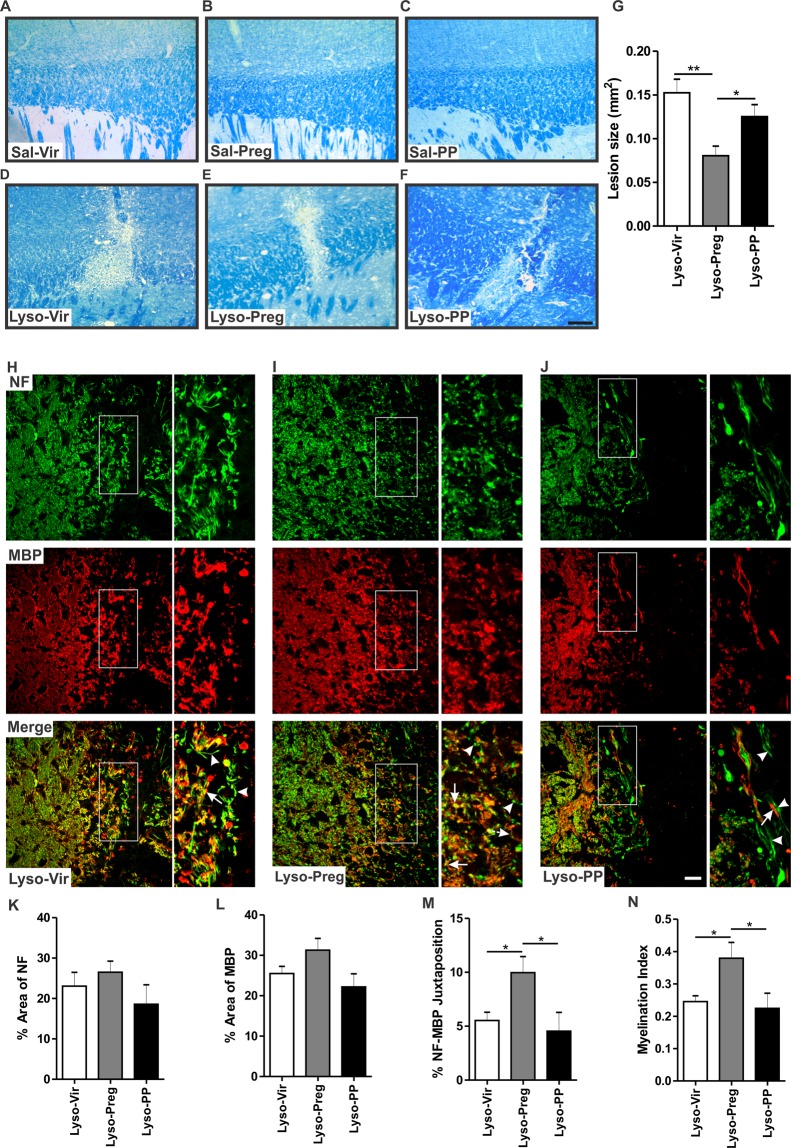
Evaluation of lesion size and axonal integrity 7 days following lysolecithin-induced demyelination. (A–C) show representative images of LFB staining in saline-injected corpora callosa of virgin, pregnant, and postpartum animals respectively. (D–F) show representative images of LFB staining in lysolecithin-injected corpora callosa. (G) The bar graph shows the demyelination lesion size in the three lysolecithin-injected groups. Pregnant animals had a smaller lesion size compared to both the virgin group (Lyso-Vir: n = 6, Lyso-Preg: n = 6, p < 0.01) and the postpartum group (Lyso-PP: n = 5, p < 0.05). (H–J) show immunofluorescent images of NF (green) and MBP (red) at the edge of the demyelination lesion in virgin, pregnant, and postpartum animals respectively. Arrowheads indicate unmyelinated axons while arrows indicate myelinated ones. There was no significant difference in either the percentage area covered by NF+ fibers (K) or the percentage area covered by MBP+ fibers (L) between the experimental groups (Lyso-Vir: n = 5, Lyso-Preg: n = 4, Lyso-PP: n = 4, p > 0.05). (M) Pregnant animals had a significantly higher percentage of juxtaposed NF+ and MBP+ fibers compared to both virgin and postpartum animals (p < 0.05). (N) Pregnant animals had a significantly higher myelination index compared to virgin and postpartum animals (p < 0.05). Data are represented as mean ± SEM. Scale bar in LFB data = 200 µm. Scale bar in immunofluorescence data = 50 µm.

