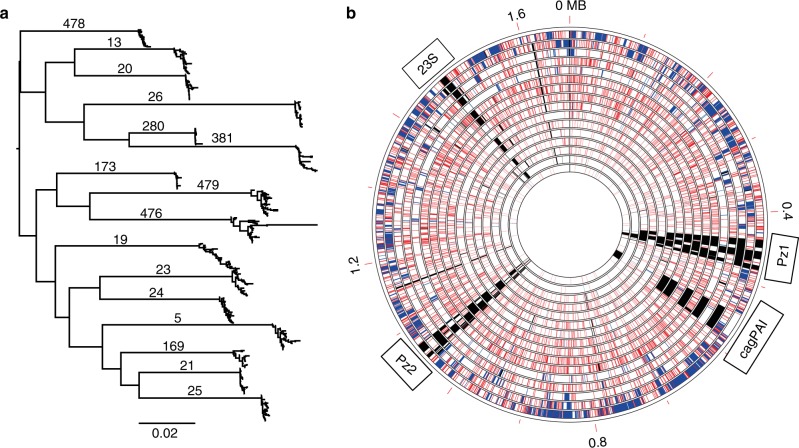
Fig. 1.
Genetic diversity within H. pylori populations from 16 human individuals. a Global phylogeny including 440 H. pylori isolates from 16 human individuals. Isolates from the same patient are clustering together tightly indicating that no mixed infection was sampled. The scale bar represents the number of substitutions per site. Source data are provided as a Source Data file. b Every circle represents the H. pylori population from one individual patient. Each population consists of 20–30 clones (see text for details). Circles are ordered by decreasing genetic within-host diversity from outer to inner circle. From the outer to inner ring: patient 476, 479, 25, 19, 169, 24, 21, 13, 5, 381, 23, 26, 20, 478, 173, 280. Genetic coordinates were synchronized across all populations by mapping onto the reference strain 26695. Spontaneous mutation and recombination events are represented by red and blue lines, respectively. Regions present in 26695 but not fully covered in a population are indicated by black lines (the 23S region indicated here corresponds to the second copy, which is not always properly assembled in draft genomes, resulting in uncovered regions)

