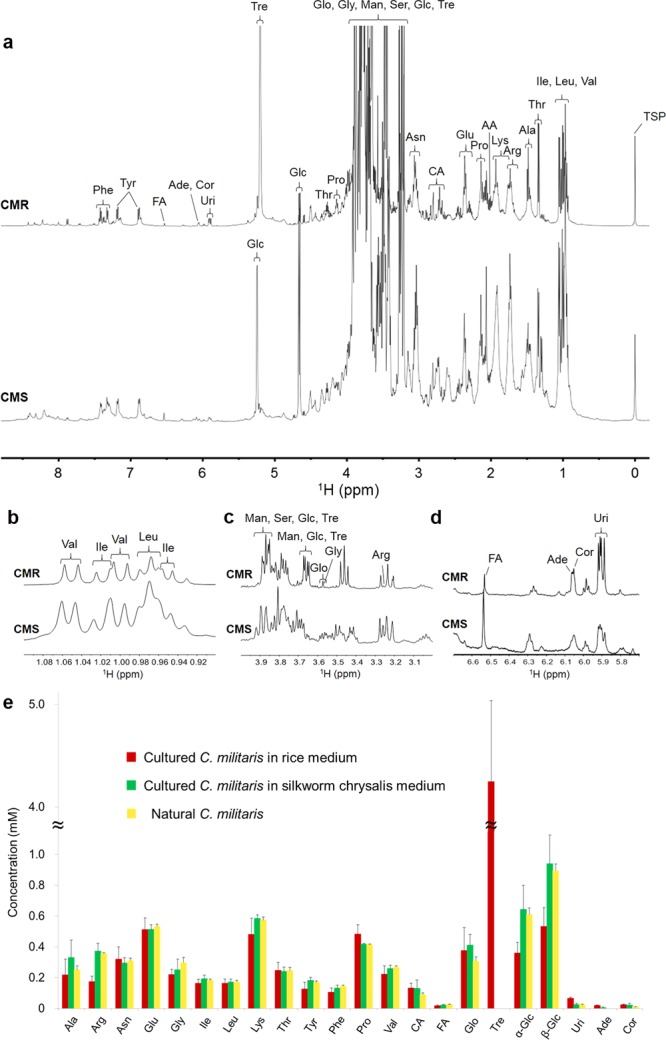
Figure 3.

NMR spectral analysis of cultured Cordyceps. (a‒d) 1H NMR spectra (a, −0.2 to 8.8 ppm; b, 0.9 to 1.1 ppm; c, 3.0 to 4.0 ppm; and d, 5.85 to 6.6) of the extracts of C. militaris cultured in a silkworm chrysalis medium (CMS) and in a rice medium (CMR). (c) Concentrations of the organic compounds in extracts from C. militaris cultured in a silkworm chrysalis medium and a rice medium determined by NMR spectroscopy. The extracts of natural C. militaris (n = 3) were compared with those of C. militaris cultured in a silkworm chrysalis medium and a rice medium (n = 5). The other abbreviations are the same as those in Fig. 1. Data are represented as the means ± SD.
