Fig. 4.
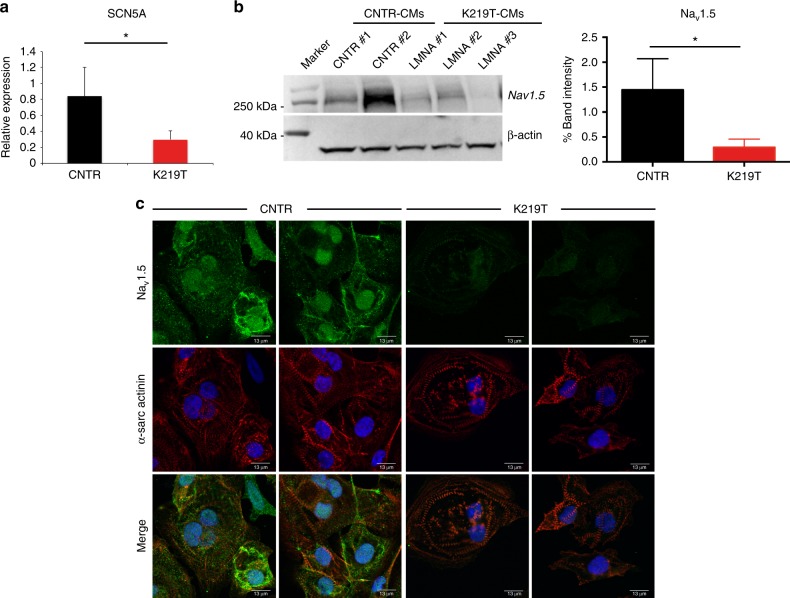
Reduced sodium current density is dependent upon reduction of SCN5A expression. a RT-qPCR showing reduced expression of SCN5A gene in CMs generated from K219T-LMNA-iPSCs vs those differentiated from CNTR lines. Data are represented relative to CNTR-CMs and normalized for expression of the housekeeping genes 18S and HGPRT. Data are relative to CMs differentiated from 2 independent lines from 2 CNTR and 3 K219T-LMNA subjects. b Left: Representative Western blot showing reduced Nav1.5 channel expression in K219T-CMs. Data are representative of one cell line per subject. Right: Nav1.5 expression quantification in CNTR-CMs and K219T-CMs, calculated as densitometric Nav1.5 /β-actin ratio (the diagram represents the mean of three independent experiments). c Representative immunofluorescence images for Nav1.5 (green) and α-sarcomeric actinin (red) in CNTR-CMs and K219T-CMs; nuclei are stained with DAPI (Scale bars: 13 μm). A decrease in the expression of Nav1.5 in K219T-CMs vs. CNTR-CMs is evident. All values are reported as mean ± SD. *p < 0.05 (unpaired t-test)

