Fig. 7.
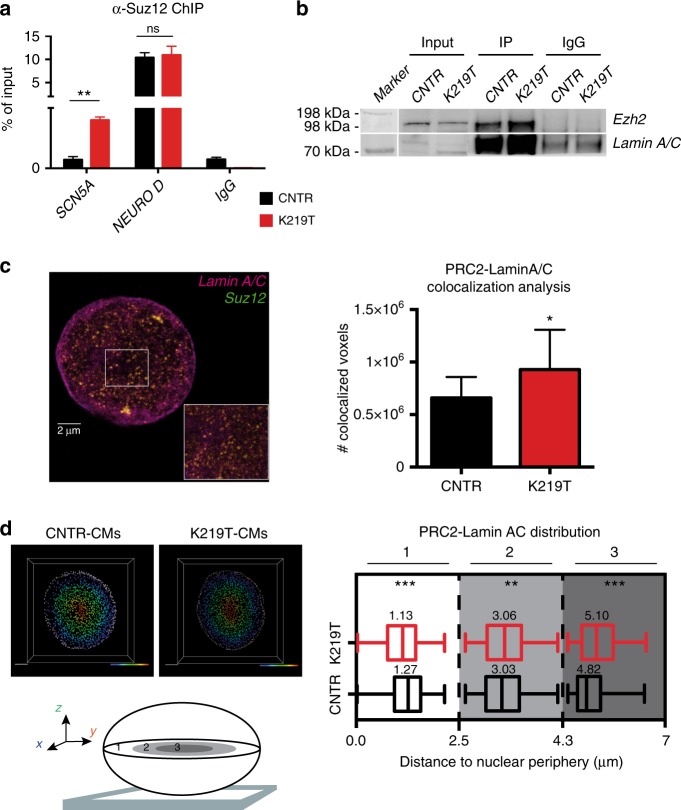
Lamin A/C–PRC2 interplay in the regulation of SCN5A transcription. a ChIP against Suz12, showing enrichment at the SCN5A promoter region in K219T-CMs. No significant differences were detectable at the NEURO D promoter, used as positive control for the antibody. Data are presented as percentage of input chromatin precipitated and relative to 2 independent iPSC lines per subject. (**p < 0.01, unpaired t-test). b Co-immunoprecipitation (co-IP) of LaminA/C and Ezh2 (PRC2 subunit) in CNTR-CMs and K219T-CMs, showing a higher binding affinity of mutant LaminA/C for Ezh2. An unrelated IgG antibody was used as negative control. One representative (out of three) experiment is shown. c 3D-STED super-resolution microscopy for Lamin A/C and Suz12. Left: representative image of a nucleus stained for the two proteins. The inset shows co-localization of the two proteins (yellow spots). Right: bar graph indicating the quantification of voxels of colocalization and showing higher levels of interaction in K219T-CMs vs. CNTR-CMs. (n = 16 cells for each condition). (*p < 0.05, unpaired t-test). d Distribution profile of the PRC2–Lamin A/C colocalization channel from 3D-STED microscopy acquisitions. For the analysis, the distance transformation function of Imaris software was applied to the z-stack images. Left: Strategy to determine the distance of the PRC2–Lamin A/C colocalization signal from the nuclear periphery. Top left: representative images of CNTR-CM and K219T-CM nuclei (scale bar 2 μm). Gray spots indicate Lamin A/C fluorescent signal: this was selected as the outside ring and served as the nuclear edge. The colored bar is indicative of the relative position of the spots to the nuclear edge: farthest positions in violet, closest in red. Bottom left: strategy of data representation: distances were scored into three zones: (1) periphery (from 0 to 2.15 μm, white); (2) middle (from 2.15 to 4.3 μm, light gray); and (3) central zone (from 4.3 to 6.45 μm, dark gray). The distance of every single colocalization spot was calculated from the nuclear edge. Right: box plot graphs representing PRC2–Lamin A/C distribution in the three selected zones. For each box plot, bottom and top of the boxes respectively indicate the lower and upper quartiles of the data set and whiskers represent the highest and the lowest values. Center line is the median value. Values are referred to median ± SD (n = 5 cells per condition, obtained from 5 independent iPSC clones). (***p < 0.0001; **p < 0.01, two-way ANOVA)

