Fig. 8.
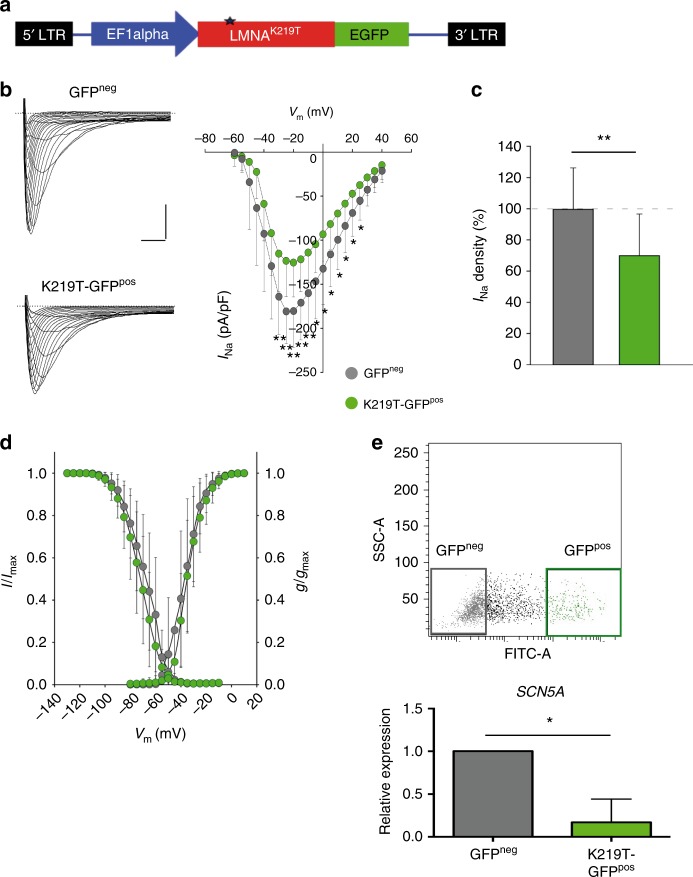
K219T-LMNA overexpression in RUES2-CMs reproduces phenotypes of K219T-CMs. a Lentiviral vector expressing the C-terminal GFP-tagged K219T-Lamin A/C used for lentiviral particle production. b Analysis of sodium current (INa) densities in CMs differentiated from the human embryonic stem cell line RUES2 and transduced with lentiviral particles expressing K219T-LaminA/C-GFP. Left column: examples of INa traces recorded in GFPneg (top) and GFPpos CMs (bottom) (Scale bar, 2 ms, 50 pA/pF). Right panel: I-V curves constructed from average peak sodium current density as a function of voltage command measured in GFPneg and GFPpos CMs. (GFPneg: n = 14; GFPpos: n = 21), showing significant Na+ current reductions in GFPpos cells. c INa density, measured at −30 mV, in GFPpos (115.20 ± 43.35 pA/pF) vs. GFPneg (164.02 ± 43.18 pA/pF) CMs, expressed as a percentage. d Voltage dependences: steady state activation (GFPneg: n = 14; GFPpos: n = 21)/inactivation (GFPneg: n = 11; GFPpos: n = 17) curves. e RT-qPCR comparing SCN5A expression in GFPneg and GFPpos CMs isolated through FACS sorting. Data are represented relative to GFPneg samples and normalized to expression of HGPRT and 18S housekeeping genes. Top: gating strategy and cell populations selected for the sorting are shown (sequential sorting strategy is provided in the Supplementary Fig. 15). All values are reported as mean ± SD. *p < 0.05; **p < 0.005 (unpaired t-test)

