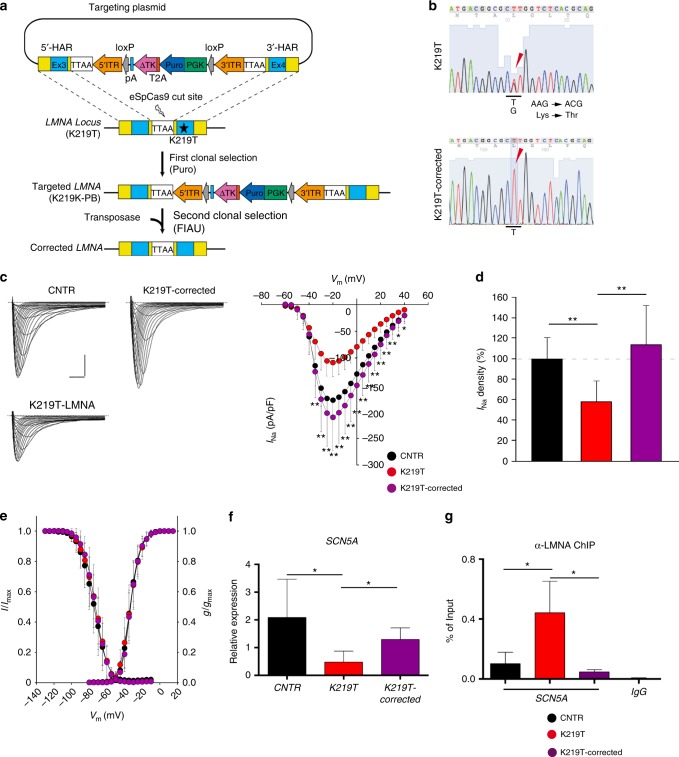
Fig. 9.
Correction of K219T mutation rescues Na+ current phenotype and SCN5A expression. a Gene editing strategy used for the correction of the mutation. b Representative electropherograms from DNA sequencing of exon 4 of the LMNA gene showing the correction of the alanine-to-cytosine transversion at position 656 (c.656A<C) in the generated isogenic K219T-corrected iPSC lines (the reverse sequence is shown in the figure; the T<C mutation is indicated by the arrow). The nucleotide mutation corresponds to the amino acid change p.K219T. The electropherogram from the parental K219T-LMNA iPSC line is shown on the top panel as reference. c Left panel: examples of Na+ current (INa) traces recorded in CNTR- (top), K219T-corrected (top) and K219T- (bottom) CMs (Scale bar, 2 ms, 50 pA/pF). Right panel: I-V curves constructed from average peak sodium current density as a function of voltage command measured in the three conditions described above (CNTR: n = 23; K219T-corrected: n = 14; K219T: n = 22), showing significant sodium current increases in K219T-corrected cells with respect to the parental mutant CMs. *adj.p < 0.05; **adj.p < 0.005 (two-way ANOVA). d INa density, measured at −30 mV, in K219T-corrected CMs (176.94 ± 61.05 pA/pF) relative to K219T-CMs (91.58 ± 30.69 pA/pF) and CNTR-CMs (156.12 ± 33.73 pA/pF) expressed as a percentage. e Voltage dependences: steady state activation (CNTR: n = 23; K219T-corrected: n = 14; K219T: n = 22)/inactivation (CNTR: n = 18; K219T-corrected: n = 12; K219T: n = 17) curves. f RT-qPCR showing that SCN5A gene expression is restored to control levels in CMs generated from K219T-corrected-iPSCs. Data are represented relative to CNTR-CMs and normalized to expression of the housekeeping genes 18S and HGPRT. g ChIP against Lamin A/C, showing loss of Lamin A/C binding at the SCN5A promoter region in K219T-corrected CMs vs mutant K219T-CMs. Levels of Lamin A/C binding are instead indistinguishable from those detected in CMs differentiated from control cells. All values are reported as means ± SD. *adj.p < 0.05; **adj.p < 0.005 (one-way ANOVA), unless otherwise specified

