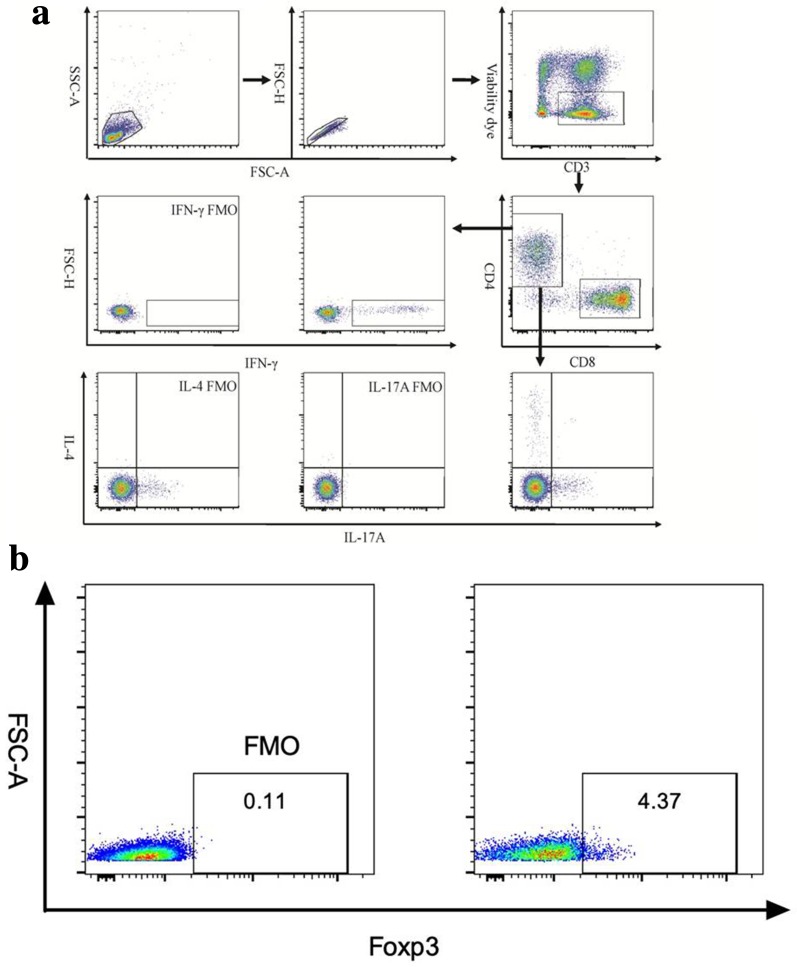
Fig. 1.
a Representative plots and gating information of T helper type 1, 2 and 17 (Th1, Th2, and Th17, respectively) cells from the T-cell fluorescence-activated cell sorting (FACS) analysis. Lymphocytes were first gated from peripheral blood mononuclear cells. The samples were analyzed using a BD FACS Canto II system and FlowJo cell analysis software (see text). FSC Forward scatter, FMO fluorescence Minus One control, INF interferon, IL interleukin, SSC side scatter. b Representative plots and gating information on regulatory T (Treg) cells from the T-cell FACS analysis

