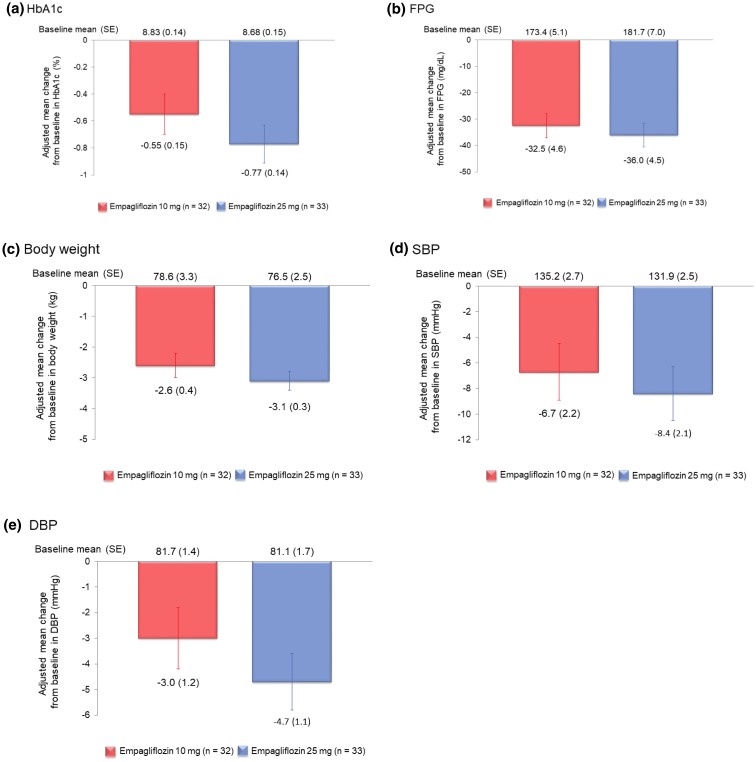
Fig. 3.
Changes from baseline to week 52 in a HbA1c, b FPG, c body weight, d SBP and e DBP. Data are shown as the mean ± standard error (SE). For HbA1c, the model includes baseline HbA1c as a linear covariate and baseline eGFR, treatment, visit, visit by treatment interaction and baseline HbA1c by visit interaction as fixed effects. A similar model was used for FPG, body weight, SBP and DBP. The model included baseline value for the corresponding endpoint and its interaction with visit as additional covariates. DBP diastolic blood pressure, FPG fasting plasma glucose, HbA1c glycated haemoglobin, SBP systolic blood pressure

