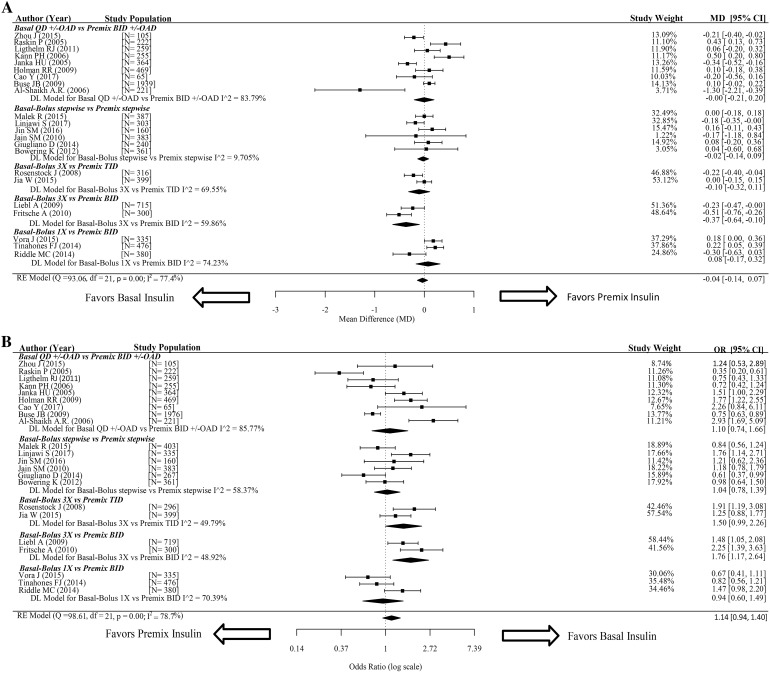
Fig. 2.
Efficacy analysis for primary comparisons. The figure depicts Forest plots for pairwise meta-analysis of efficacy outcomes for a change from baseline HbA1c and b HbA1c < 7%. The I2 value was used to assess heterogeneity. Results are shown as the mean difference (MD) for continuous data along with the associated 95% CI for change from baseline HbA1c, and the odds ratio (OR) along with the associated 95% confidence interval (CI) for HbA1c < 7%. QD once daily, BID twice daily, TID three times daily, OAD/OADs oral antidiabetic drugs, MD mean difference, OR odds ratio, CI confidence interval

