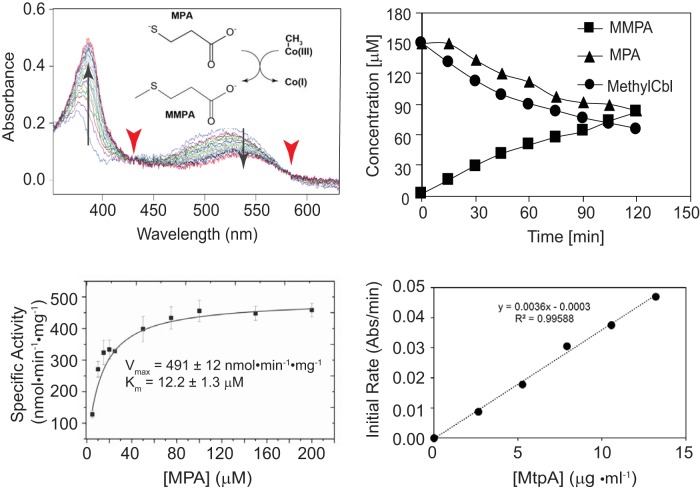
FIG 1.
MtpA-catalyzed methylation of MPA using methylcob(III)alamin. (Top left) Demethylation of methylcob(III)alamin monitored via UV-visible spectroscopy. The reaction catalyzed is shown in the inset. Spectra were collected at 30-s intervals from 0 min to 8 min. The diagnostic absorbance changes at 388 nm and 540 nm (arrow) and isosbestic points at 430 nm and 578 nm (arrowheads) demonstrate the transition from methyl-cob(III)alamin to cob(I)alamin. (Top right) Quantification of methylcob(III)alamin, MPA, and MMPA during the MtpA-catalyzed reaction. Methylcob(III)alamin was quantified by UV-visible spectroscopy. MPA and MMPA were measured by GC-MS. (Bottom left) Michaelis-Menten kinetics of MtpA. (Bottom right) Methyltransferase reaction is proportional to MtpA concentration. Rates were determined with 150 μM methylcob(III)alamin, 2.7 to 13.5 μg MtpA, 100 mM ZnCl2 and 5 mM Ti(III) citrate.

