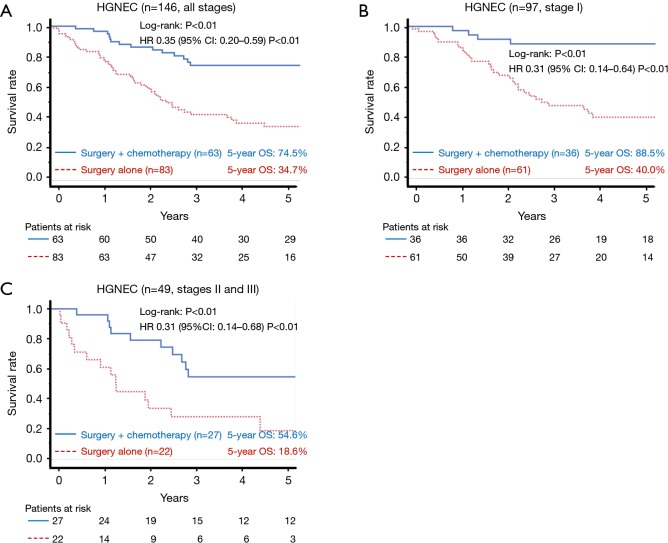
Figure 2.
A comparison of the overall survival according to the treatment group in all-stage patients (A), stage I patients (B) and stage II and III patients (C). A significant difference in the survival was observed between the groups (log-rank: A: P<0.01, B: P<0.01, C: P<0.01). HGNEC, high-grade neuroendocrine carcinoma; OS, overall survival; HR, hazard ratio; CI, confidence interval.

