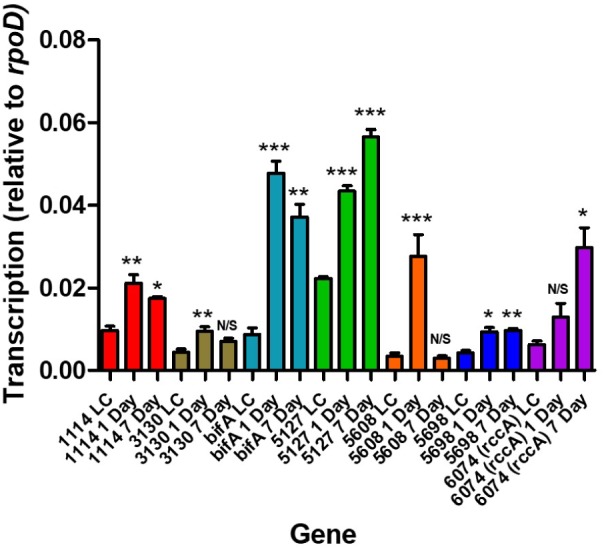
FIGURE 2.

RT-qPCR analysis of rhizosphere-upregulated genes showing transcript abundance during 1- and 7 days colonization of model wheat rhizospheres relative to transcription in liquid culture (denoted LC). Statistically significant differences between transcript levels during colonization and the respective liquid culture control were analyzed using Dunnett’s Multiple Comparison ANOVA test with a minimal requirement of P < 0.05 (∗P ≤ 0.05; ∗∗P ≤ 0.01; ∗∗∗P ≤ 0.001). N/S, not significant.
