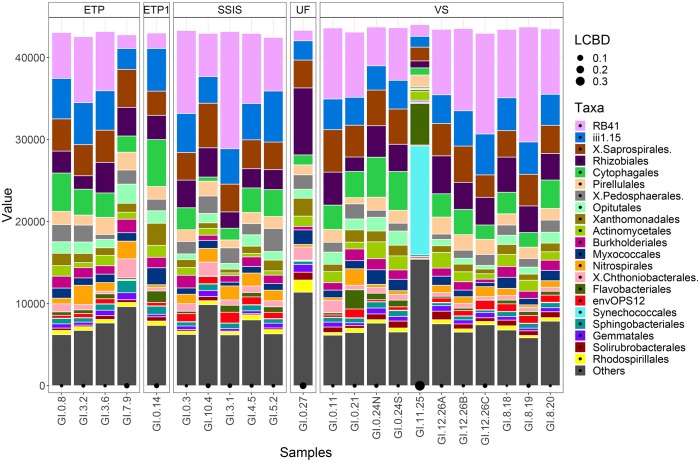
FIGURE 2.
Bacterial communities were normalized to the lowest sequence count of the samples (44,702). The taxa sequence abundances are grouped by the different GI designs: Enhanced Tree Pit (ETP), Modified Enhanced Tree Pit (GI.0.14; ETP1), Street-Side Infiltration System (SSIS), Vegetated Street (VS), and Urban Forest (GI.0.27; UF). Taxa of the bacteria communities are represented by the top 20 Orders with the remaining Orders clustered into the Other category. Local contribution to beta diversity (LCBD) indicates the uniqueness of a community with the black circles along the x-axis, size corresponds to the scaled difference.

