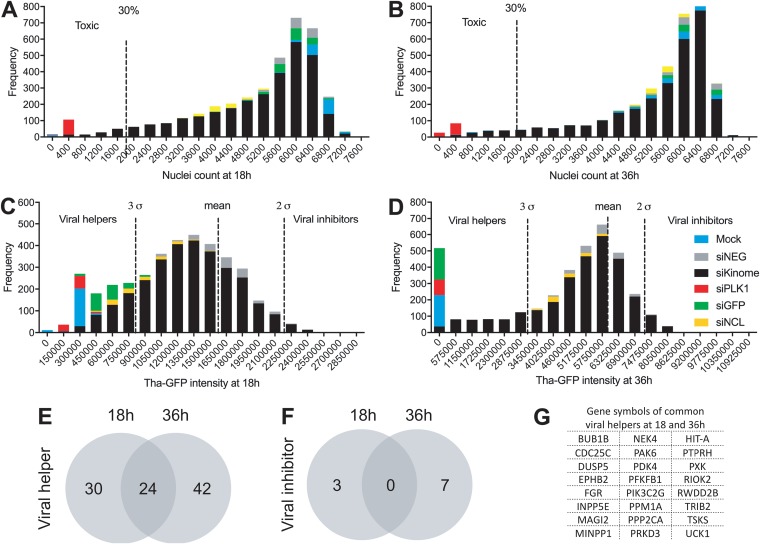
FIG 1.
Quality control of the kinome-wide screening and identification of the major hits. (A to D) Population distribution of all hits according to the number of cells at 18 h (A) or 36 h (B) and GFP intensity at 18 h (C) or 36 h (D). The mock infection data correspond to noninfected and nontransfected cells. (E and F) Venn diagrams showing the distribution of the high-confidence hits identified as representing “viral helpers” (E) and “viral inhibitors” (F) at between 18 and 36 h. (G) List of the common hits found at both 18 and 36 h.

