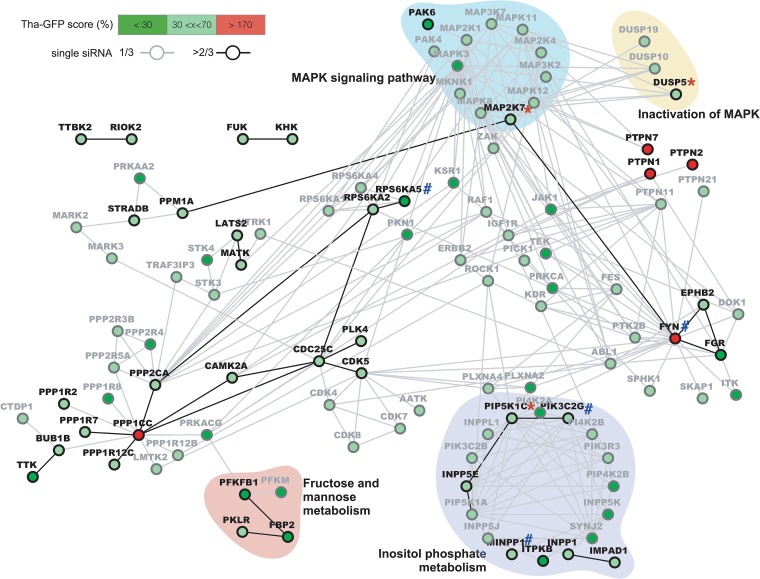
FIG 3.
Protein network analysis of hits affecting RABV infection after 36 h. High-confidence (≥2 siRNA, black) and low-confidence (1 siRNA, gray) hit interactions were computed using STRING v10.5 and were visualized using Cytoscape v3.4. Only low-confidence hits directly interacting with at least one high-confidence hit are displayed. The Tha-GFP score corresponds to the average GFP signal measured in each active single siRNA normalized to the mean of the data from the siNEG control. Hits were retrospectively marked as validated (*) or OTE (#).

