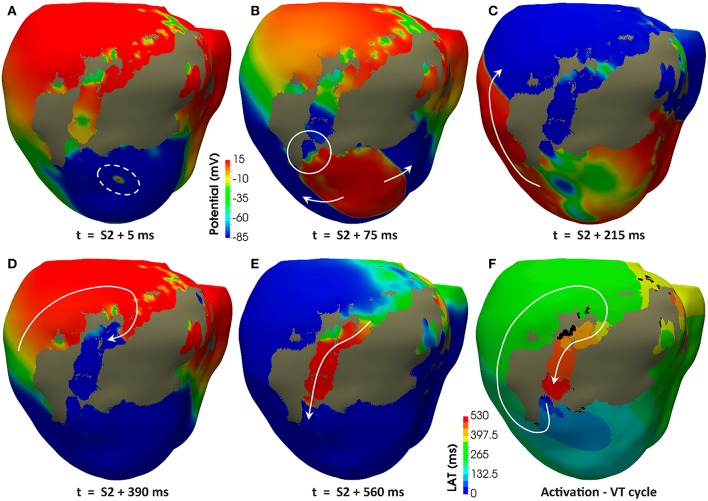
Figure 11.
Reentrant monomorphic VT induced in-silico by PES protocol. Posterior views of the 3D ventricular model displaying potential maps at different time instants of the PES protocol from pacing site epi#1 leading to positive VT induction on the model #6 (ER and 10% fibrosis in BZ). Non-excitable scar is represented in gray color. White arrows indicate direction of the depolarization wavefront. (A) Only one premature stimulus (S2) was delivered at a CI of 360 ms. (B) The wavefront generated by S2 stimulus causes a functional propagation block at the lower side of the epicardial isthmus (see white circle). (C) The wavefront continues propagating around the infarct scar, but not through the epicardial isthmus due to the functional block caused by S2 stimulus. (D) The wavefront reaches the upper side of the epicardial isthmus after propagating all around the infarct scar. (E) The wavefront enters through the upper side of the epicardial isthmus, propagating across the channel until leaving it through its lower side (unidirectional block) to propagate again around the scar, giving rise to a reentrant activity leading to a self-sustained monomorphic VT. (F) Activation map of a cycle of the induced VT, confirming that the epicardial isthmus constitutes a SCC acting as structural substrate for this infarct-related VT.

