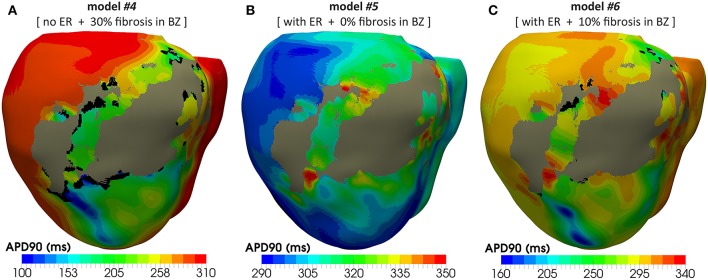
Figure 12.
APD maps resulting from the propagation of the last stimulus of the S1 phase triggered from pacing point epi#1. These maps correspond to three out of the four different versions of the ventricular model that enabled positive VT induction in in-silico tests: (A) model #4 (no ER and 30% fibrosis), (B) model #5 (with ER and 0% fibrosis), and (C) model #6 (with ER and 10% fibrosis). All of them show repolarization dispersion in the BZ surrounding the infarct scar, with a region of longer APDs at both ends of the epicardial SCC, especially at the lower side where the unidirectional propagation block that triggers the reentrant activity occurs. Black regions correspond to not activated tissue due to fibrosis accumulation.

