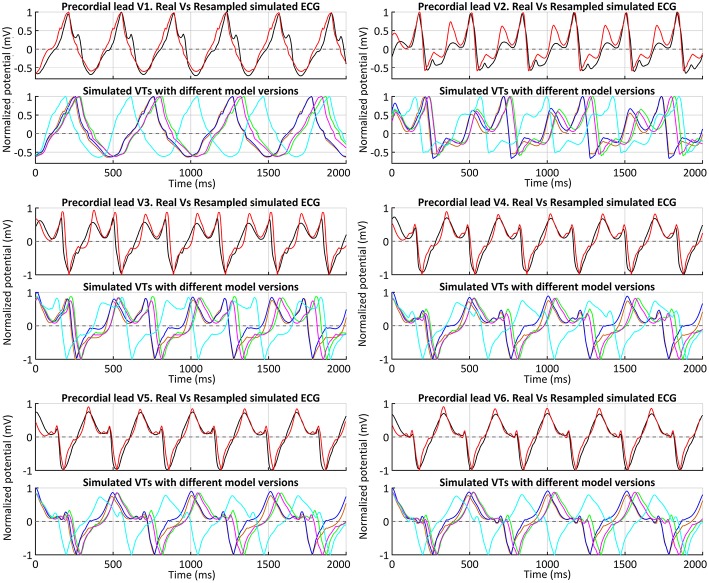
Figure 13.
ECGs during clinical VT. Comparison between real (black) and simulated ECGs with different model versions for in-silico induced VT. Simulated ECGs correspond to all model versions that enabled a positive VT induction: models #4 (orange), #5 (blue), #6 (green) and #7 (magenta). The ECG for model #6 (ER and 10% fibrosis in BZ) with the CVs reduced by 50% (instead of 75%) is also represented (cyan). Together with the patient's ECG (black), a resampled version of the ECG obtained with model #6 and CVs reduced by 75% in BZ is displayed (red) to ease a visual comparison of the waveform of both signals.

