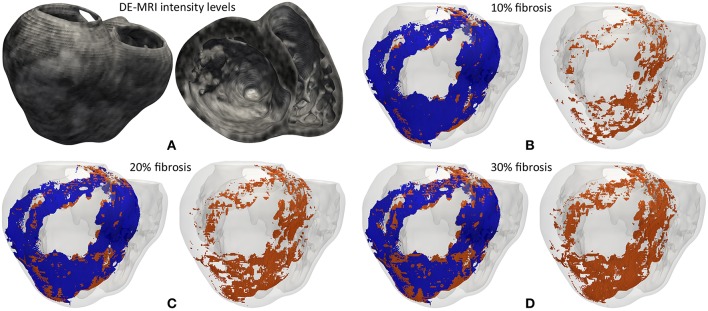
Figure 3.
(A) Gray intensity levels from DE-MRI mapped into the hexahedral volume mesh of the 3D ventricular model, showing a postero-basal view of the whole model (left) and a basal view of a cross-section in the short-axis plane (right). The next three panels show the 3D fibrosis distribution resulting from the introduction of several degrees of structural remodeling within the BZ: (B) 10%, (C) 20%, and (D) 30% patchy fibrosis. All those panels show a posterior view of the 3D surface model of ventricles (rendered with transparency) together with those hexahedral elements labeled as BZ (blue) and fibrosis (orange) extracted from the volume mesh of ventricular model. In each panel there is an image showing both the BZ and fibrosis (left) and another one only displaying the fibrotic elements (right).

