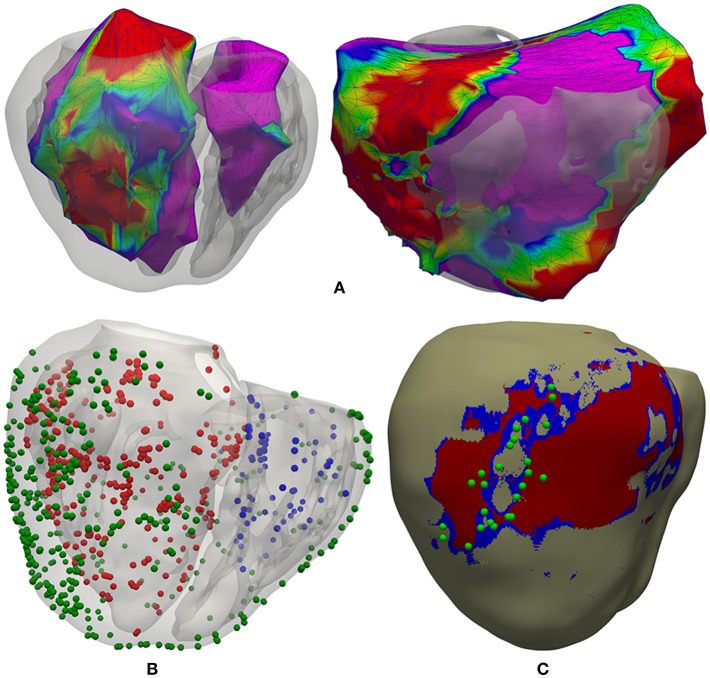
Figure 4.
Registration process between CARTO surface meshes and the 3D ventricular model. (A) Two posterior views of the 3D surface model of ventricles rendered with transparency, showing registered CARTO surfaces for both endocardia (left) and epicardium (right). (B) CARTO measurement points projected onto the 3D model with colored spheres representing CARTO points recorded from LV endocardium (red), RV endocardium (blue), and epicardium (green). (C) Postero-lateral view of the 3D ventricular model showing a possible epicardial SCC mainly composed of BZ (blue) intermingled with some thin patches of healthy tissue at epicardial level (beige) and completely surrounded by infarct scar (red), closely matching the location of projected CARTO points tagged during the RFA procedure as candidates to be part of a SCC (green spheres) according to the features of their EGMs.

