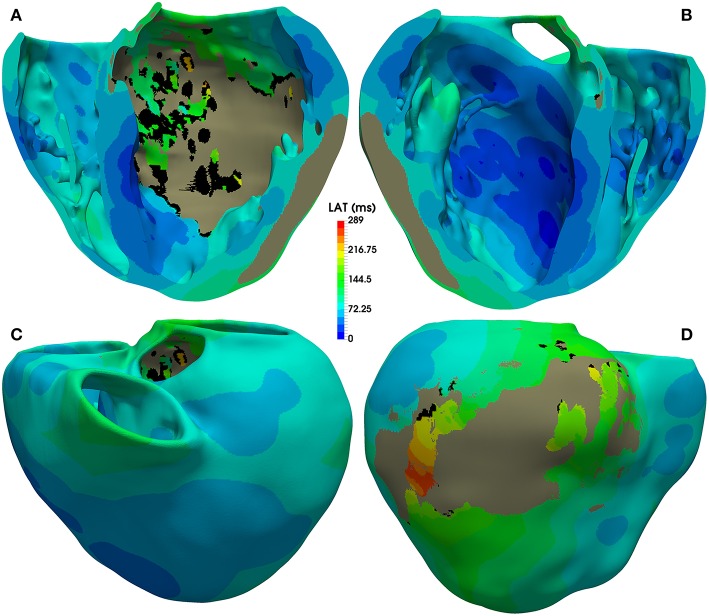
Figure 7.
Activation map for CARTO-derived sinus activation, corresponding to the sixth heartbeat simulated with the ventricular model with ER and 10% fibrosis in BZ (model #6). Top row shows an anterior (A) and a posterior (B) view of a coronal cross-section (four-chamber plane) of the ventricular model, showing the activation on the endocardial surfaces. Bottom row also displays anterior (C) and posterior (D) views of the whole model, showing the activation at epicardial level. Black regions correspond to not activated tissue (not depolarized) due to fibrosis accumulation. Gray region represents the infarct scar, modeled as non-conducting tissue.

