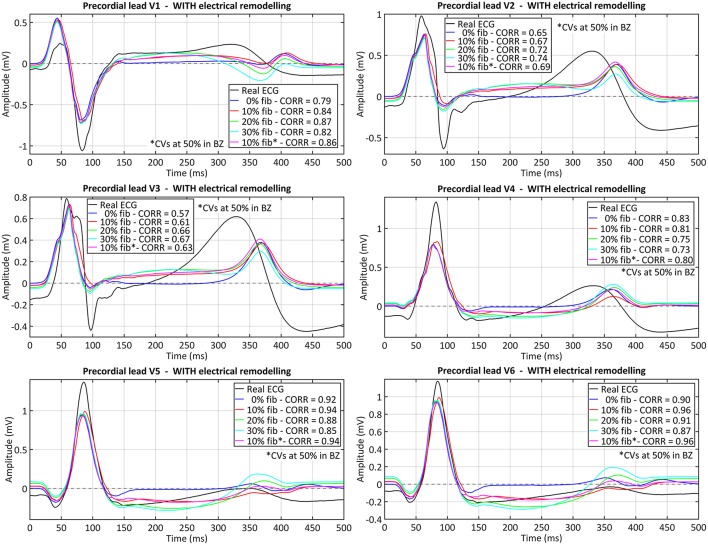
Figure 9.
Comparison between real and simulated ECG signals recorded at precordial leads in sinus rhythm. These plots display the ECG simulated with all model versions including ER (models #5–8), combined with the four tested levels of image-based patchy fibrosis in the BZ. The ECG for the model version with ER, 10% fibrosis and the CVs reduced by 50% in BZ (10% fib*), instead of 75%, is also represented. Correlation coefficients (CORR) are included in the plots legend. Those signals were obtained by propagating through the 3D torso model the sixth heartbeat simulated from the CARTO-derived sinus activation pattern at a BCL of 800 ms (75 bpm). (see Supplementary Material for simulated ECGs with model versions without ER in the BZ).

