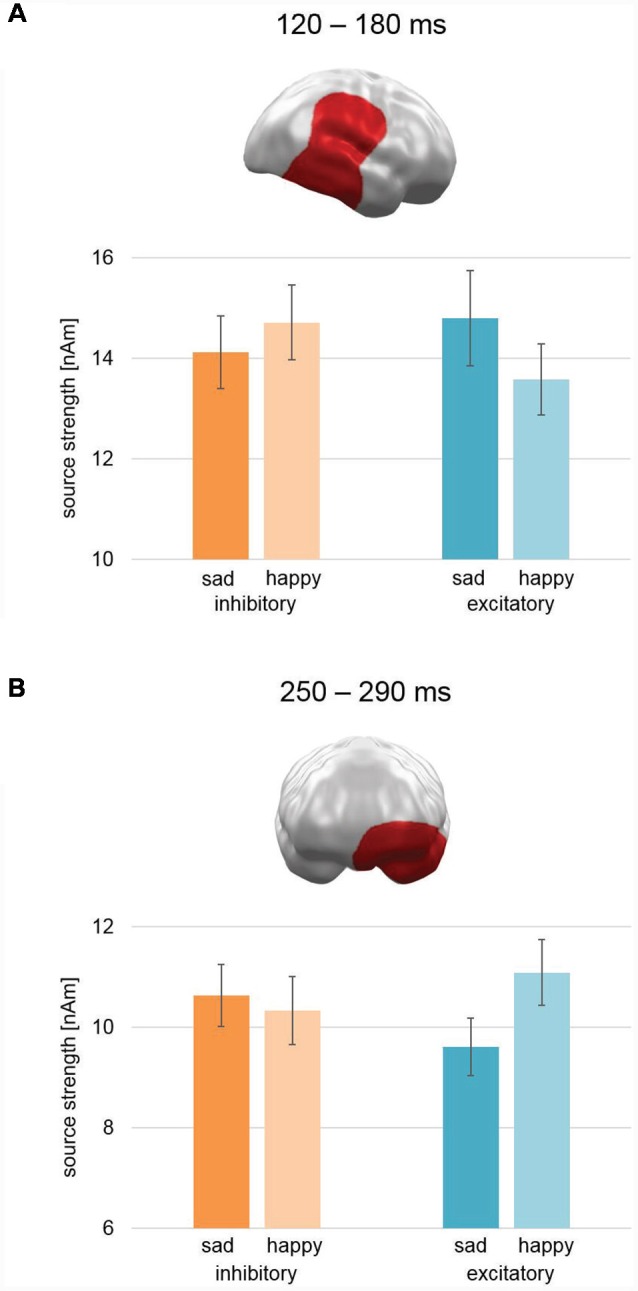
Figure 5.

Spatio-temporal clusters with significant interactions of Stimulation × Valence. (A) An early to mid-latency cluster spanning right temporal, parietal, and frontal areas—including temporal parietal junction and superior temporal cortex—showed an activation pattern opposite to our hypothesis: after excitatory vmPFC-tDCS, sad faces showed relatively higher activation than happy faces and vice versa after inhibitory vmPFC-tDCS. (B) A mid-latency cluster at left orbitofrontal and temporal pole areas revealed an effect consistent with our hypothesis: after excitatory vmPFC-tDCS, happy faces showed increased activation in comparison to sad faces and vice versa after inhibitory vmPFC-tDCS. Bar graph insets indicate standard error of the mean (± SEM).
