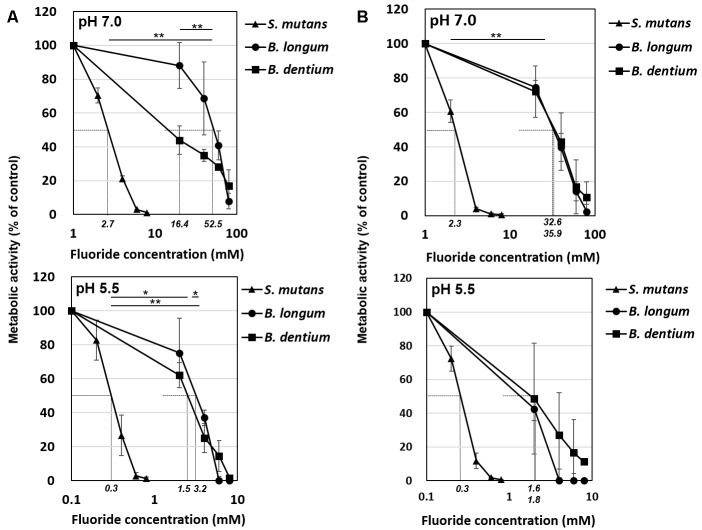
FIGURE 3.
Inhibitory effects of fluoride on bacterial acid production at pH 7.0 and 5.5. (A) Acid production from glucose. (B) Acid production from lactose. Fifty percent inhibitory concentrations (IC50) were calculated from the fluoride concentration vs. relative acid production curve. Data are shown as the mean and standard deviation of three independent experiments. The IC50 values are displayed in italics on the x-axis. The significance of differences in IC50 among B. longum, B. dentium, and S. mutans were analyzed using the Tukey test (∗∗P < 0.01, ∗P < 0.05).

