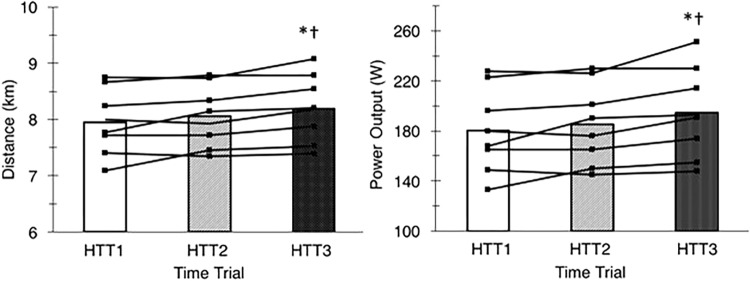
FIGURE 3.
Distance cycled (left) and mean power output (right) during time trials in hot conditions (35°C, 30% RH) performed pre-acclimation (HTT1), following 4-days heat acclimation (HTT2), and following 9-days heat acclimation (HTT3). Bars represent mean value and black lines represent individual participant data. ∗Significant increase from HTT1 (p < 0.05); †Significant increase from HTT2 (p < 0.05).

