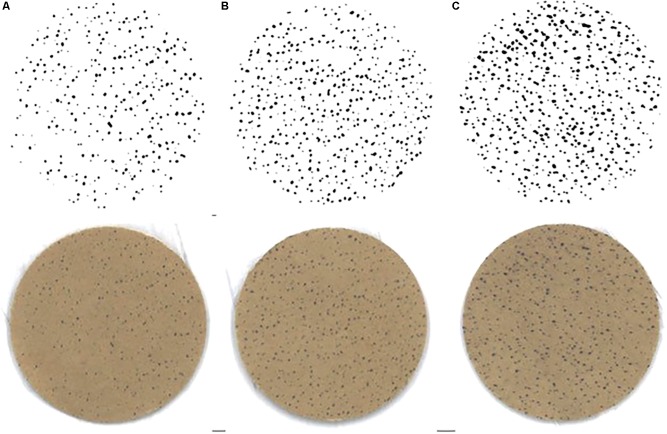
FIGURE 6.
Example of sweat gland activity measured immediately following time trials (A) pre-acclimation (HTT1), (B) following 4-days heat acclimation (HTT2), and (C) following 9-days heat acclimation (HTT3). Bottom row images are scanned copies of iodine-cotton paper applied to participant’s forearm. Top row of images are the same images following computer processing (ImageJ; Gagnon et al., 2012).

