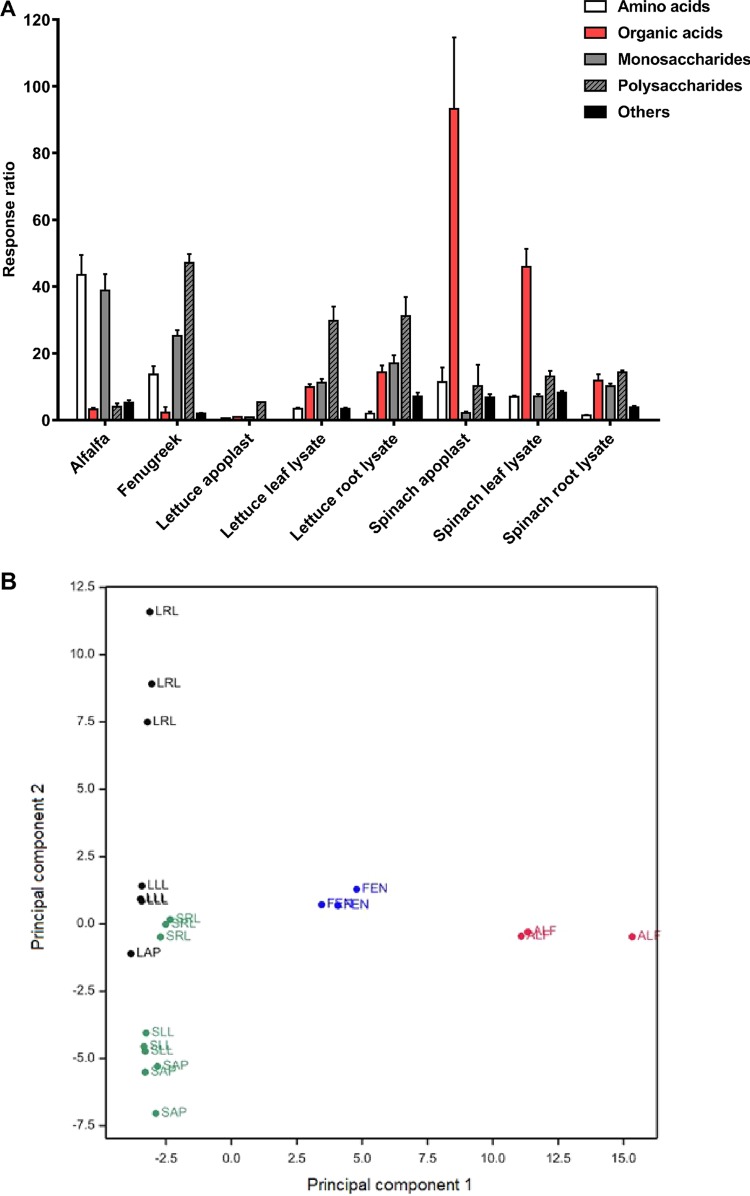
FIG 2.
Plant extract metabolomics and grouping. (A) The 60 assigned metabolites from all species and tissues are separated into amino acids, organic acids, mono- and polysaccharides, and others by their mean total response ratio (with the SD indicated by bars). (B) Score plot of principal component 1 (31% variance) and principal component 2 (19%) for all 116 polar metabolites for alfalfa (ALF) in red, fenugreek (FEN) in blue, spinach (spinach apoplast [SAP], spinach leaf [SLL], spinach roots [SRL]) in green, and lettuce (lettuce apoplast [LAP], lettuce leaf [LLL], lettuce roots [LRL]) in black.

