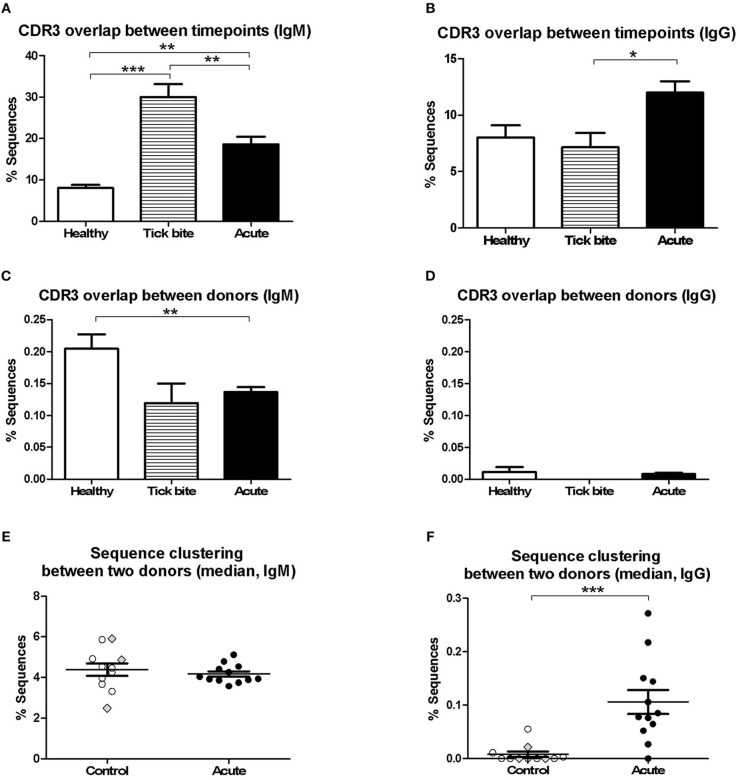
Figure 3.
Analysis of pairwise BCR repertoire sequence overlap or clustering between samples with HTS. CDR3aa sequence overlap was determined between samples from different timepoints (A,B) and donors (C,D). The overlap between different timepoints (T0-T1, T1-T2, T0-T2) were calculated for each sample and the mean with SEM from all values obtained for each group is represented. Groups were compared with One-way Analysis of Variance test followed by Tukey's Multiple Comparison test. (E,F) Sequences were clustered based on whether they contain the same V and J genes as well as similar CDR3aa sequences, allowing one in six mismatches (83% CDR3aa similarity) using the python script from Galson et al. (44, 48, 68). Comparisons were within-group of 12 acute patients (average age: 56, 75% female) and within-group of 11 controls (average age: 55, 27% female). For each donor the percentage sequence overlap between each sample (i.e., timepoint) from that donor with each individual sample of all other donors of the same group was determined. Depending on the number of available timepoints, this gave 25–69 values for each control donor and 66–96 values for each acute patient. The data points represent the median from all these values for each of the donors. Data points corresponding to the three controls with a recent tick bite are highlighted with gray filled rhombi. A Two-tailed Unpaired T-test was used to compare values from the two groups. Two-tailed unpaired t-test showed no difference in age between both groups. *p = 0.01–0.05, **p = 0.001–0.01, ***p = 0.0001–0.001.

