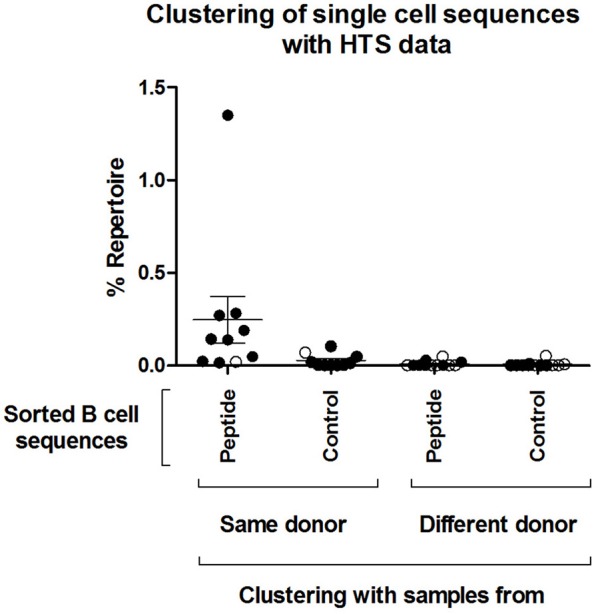
Figure 4.

Clustering of single cell sequences with deep sequencing data. Change-O (67) was used for clonal grouping of pooled HTS sequences (referred here to as “Repertoire,” including pooled IgM and IgG sequences from all sequenced timepoints) of each donor with the sequences from the isolated single cells. A clonal grouping threshold was determined with SHazaM R package (67) using the HTS data of each individual donor. This package uses distance to nearest neighbor analysis to determine the threshold. This threshold was then used to cluster the dataset containing both the HTS and all single cell sequences. The percentage of the repertoire (IgM and IgG of all three timepoints confounded) that clustered by this method to all the isolated single cell sequences from the different groups (“Peptide,” “Control”) is shown. The percentage repertoire that is related to the isolated single cells is shown. Values were separated according to whether the sequences were found in the same donor in which they were detected or in a different donor. Open circles: Control samples. Black circles: acute patient samples.
