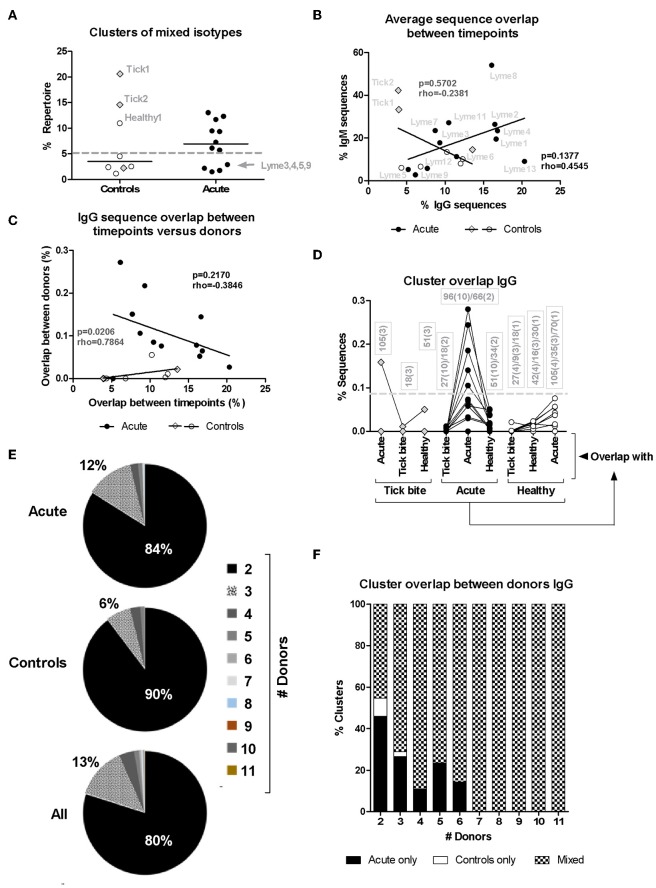
Figure 6.
Analysis of HTS sequence clustering. (A) Mixed clones obtained using Change-O (67) that contained sequences of both IgM and IgG isotypes were selected and the percentage of the total repertoire (all samples from the same donor pooled) they represent is shown. (B) Correlation between average IgM and IgG CDR3aa sequence overlap between timepoints for the different patients (closed symbols) and controls (open symbols). (C) Correlation between IgG CDR3aa sequence overlap between timepoints (average) and clustering between donors (median) (44, 48, 68) is represented. Spearman's Rank Correlation Hypothesis Testing was done manually in Excel. (D) Sequence clustering between all donors was determined using the python script from Galson et al. (44, 48, 68). Median values were calculated as before (Figure 4) but here the sequence overlap between samples belonging to different groups was also assessed. Lines connect values of the same donor. The boxes show the number of sequence overlap values calculated and used to generate the median values presented. The brackets give the number of donors for which this number of sequence overlap values was used to calculate the median value shown. Dashed line: 5/12 (42%) acute patients but only 1/11 (9%) controls showed median values above this threshold. (E,F) Distribution of overlapping clusters among donors.

