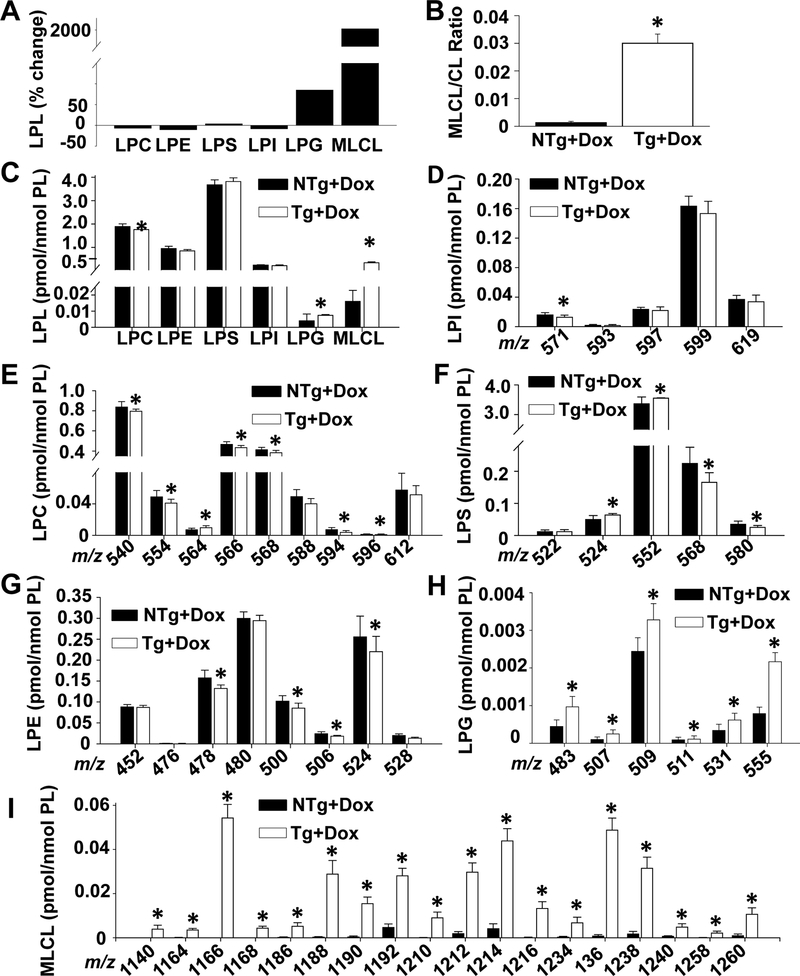
Figure 3.
Brain lysophospholipid levels are altered in TAZ kd mice.
Liquid chromatography-mass spectrometry was used to quantitate lysophospholipid amounts in whole brain. Total lysophospholipid values are expressed as a % change in the Taz kd mice (Tg +dox) compared to the littermate (NTg +dox) controls [((NTg+dox) – (Tg+dox))/(NTg +dox)x100] (A), as a ratio of total MLCL/total CL (B) or pmol/nmol total PL (C). Individual lysophospholipid species were quantitated and arranged by mass (m/z) for LPI (D), LPC (E), LPS (F), LPE (G), LPG (H) and MLCL (I). Data are means ±SD (n=8). *p<0.05 compared with NTg +dox mice. †p<0.05 Tg +dox compared to all other groups.

