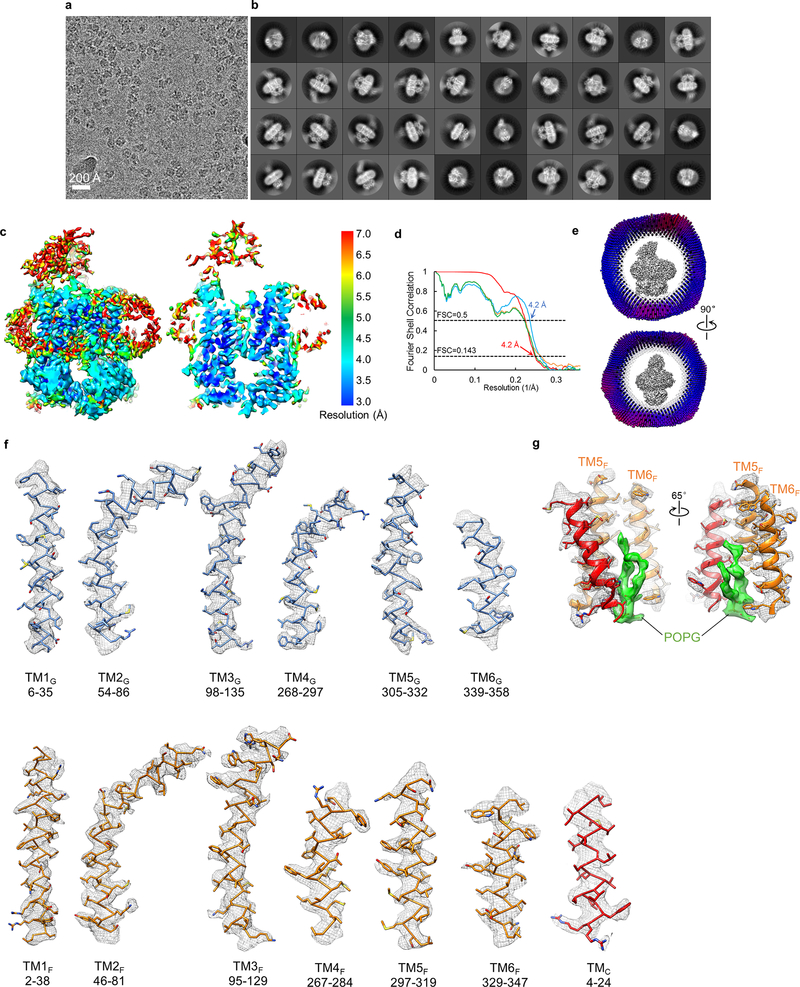
Extended Data Figure 6 |. Single-particle cryo-EM analysis of nucleotide-free LptB2FGC in nanodiscs.
a, Representative cryo-EM image of nucleotide-free LptB2FGC in nanodiscs. b, 2D class averages of cryo-EM particle images. c, Local resolution of the final cryo-EM map of nucleotide-free LptB2FGC. d, Fourier shell correlation (FSC) curves: gold-standard FSC curve between the two half maps with indicated resolution at FSC=0.143 (red); FSC curve between the atomic model and the final map with indicated resolution at FSC=0.5 (blue); FSC between half map 1 (orange) or half map 2 (green) and the atomic model refined against half map 1. e, Cutaway views of angular distribution of particles included in the final 3D reconstruction. f, Cryo-EM densities superimposed with the atomic model for individual TM helices in the nucleotide-free LptB2FGC. g, Cryo-EM density superimposed with the atomic model for a lipid molecule (POPG in green) and surrounding TMC, TM5F and TM6F. This density was modeled as a POPG molecule, because POPG was used for nanodisc reconstitution and is also abundant in the IM of E. coli. EM data collection and 2D classification were performed once.

