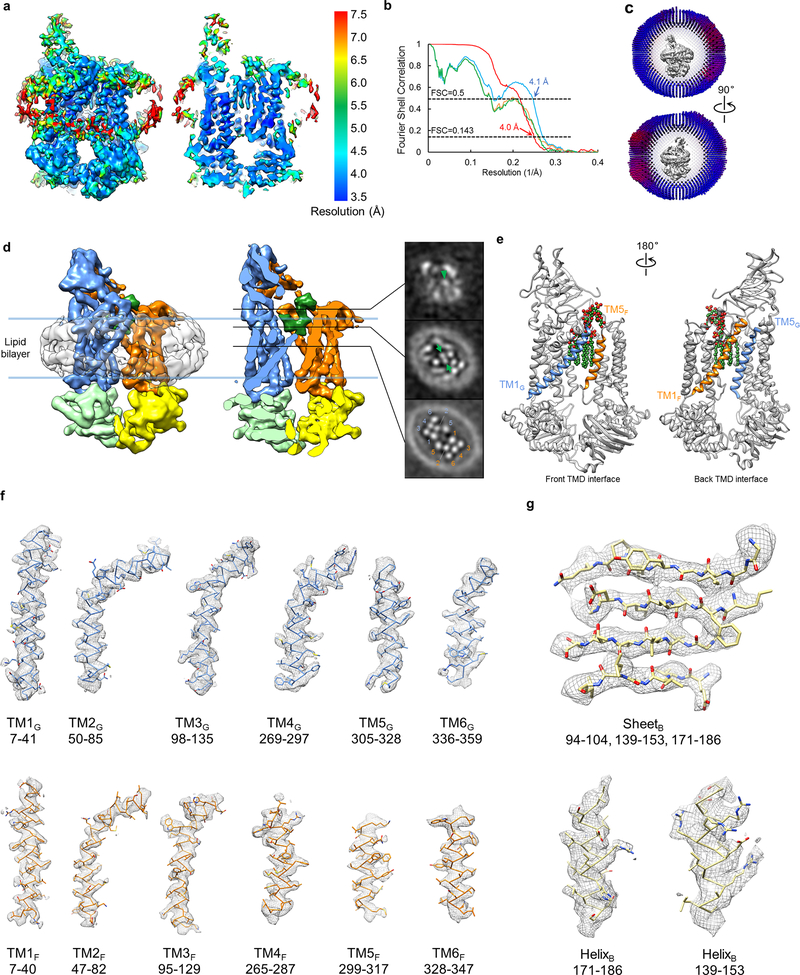
Extended Data Figure 3 |. Single-particle cryo-EM analysis of nucleotide-free LptB2FG in nanodiscs.
a, Local resolution of the final cryo-EM map of nucleotide-free LptB2FG. b, Fourier shell correlation (FSC) curves: gold-standard FSC curve between the two half maps with indicated resolution at FSC=0.143 (red); FSC curve between the atomic model and the final map with indicated resolution at FSC=0.5 (blue); FSC curve between half map 1 (orange) or half map 2 (green) and the atomic model refined against half map 1. c, Cutaway views of angular distribution of particle images included in the final 3D reconstruction. d, Surface view and sectional view of the cryo-EM map of nucleotide-free LptB2FG filtered to 6 Å resolution to show the lipid nanodisc, overall arrangement of TM helices, β-jellyroll domains and LPS (left). Slices through the cryo-EM map at the indicated planes. Arrowhead and arrows indicate the inner core and the phosphorylated glucosamines, respectively. Individual TM helices are numbered in the lower slice view. This analysis was performed once. e, Front and back TMD interfaces formed by the TM1 and TM5 helices from LptF and LptG, colored in orange and blue, respectively. LPS is shown as spheres. f, Cryo-EM densities superimposed with the atomic model for individual TM helices in the nucleotide-free LptB2FG. g, Cryo-EM densities superimposed with the atomic model for selected regions of the NBDs (LptB), demonstrating the clear separation of the β-strands and side chain densities.

