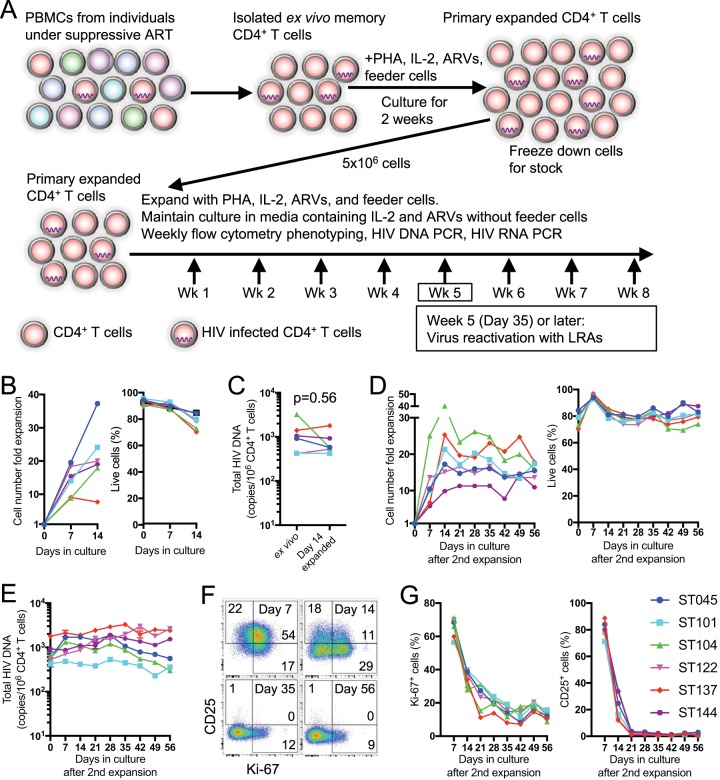
FIG 1.
Reestablishment of a resting state of CD4+ T cells after in vitro expansion from primary memory CD4+ T cells. (A) Schematic of primary CD4+ T cell expansion, culture, and experimental design. (B) Purified CD45RA− CD4+ T cells from PBMCs were expanded with PHA and IL-2, and their fold expansion based on the initial input cell number was determined at 0, 7, and 14 days after stimulation. The frequency of live cells in the culture was determined by Aqua Live/Dead flow cytometric staining is shown. (C) Total HIV DNA copies/106 cells among ex vivo CD4+ T cells or CD4+ T cells 14 days after expansion. (D) CD4+ T cells from initial expansion were further expanded with PHA and IL-2. Their fold expansion and frequency of live cells was determined weekly until 56 days after secondary stimulation. (E) Total HIV DNA copies/106 cells among CD4+ T cells after secondary expansion. (F) Representative dot plot for coexpression of Ki-67 and CD25 in/on CD4+ T cells after secondary expansion. (G) Percentages of Ki-67+ and CD25+ cells in/on CD4+ T cells from six subjects after secondary expansion.

