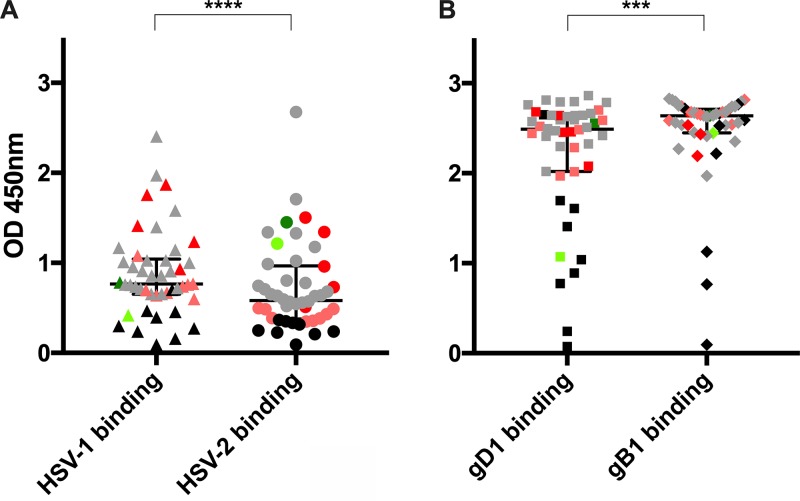
FIG 3.
Characterization of binding to purified virions and soluble glycoproteins. Graphs show the results from binding analysis of 44 sera to HSV-1 (▲) and -2 virions (●) (A) and soluble glycoprotein D (■) and B (◆) of HSV-1 (B). Sera were used at a 1:200 dilution. The median optical density (OD450), with interquartile range, is reported for each binding analysis (***, P < 0.001; ****, P < 0.0001). Each data point is represented by its stratification color: sera able to bind only HSV-1 (light red) or only HSV-2 (light green), sera that bind both viruses equally (gray), sera that preferentially bind HSV-1 over HSV-2 (red) and vice versa (green), and negative sera (black).

