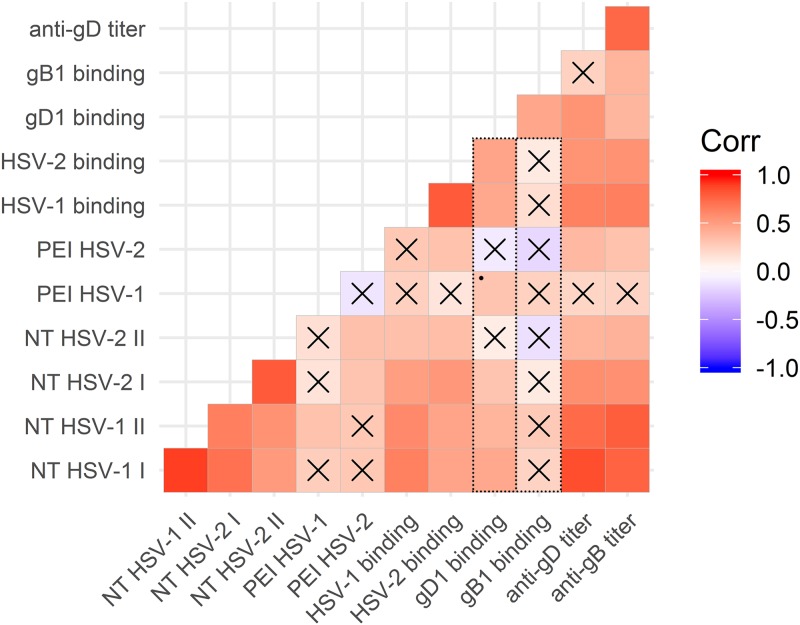
FIG 7.
Graph of correlation matrix in R. Matrix heatmap plot corresponding to ρ correlation values between categories corresponding to parameters analyzed for the sera: binding to gD and gB, neutralizing activity, anti-gD and gB antibody titers, and postentry inhibition of the infection. Color scale indicates correlation values, with positive correlations assigned to red colors. X indicates Padj value of <0.05. *, Padj = 0.053. NT, neutralization assay. Roman numbers indicate 1:200 (I) and 1:400 (II) serum dilutions. Dotted boxes highlight how overall biological activities correlate with the binding to gD but not to gB.

