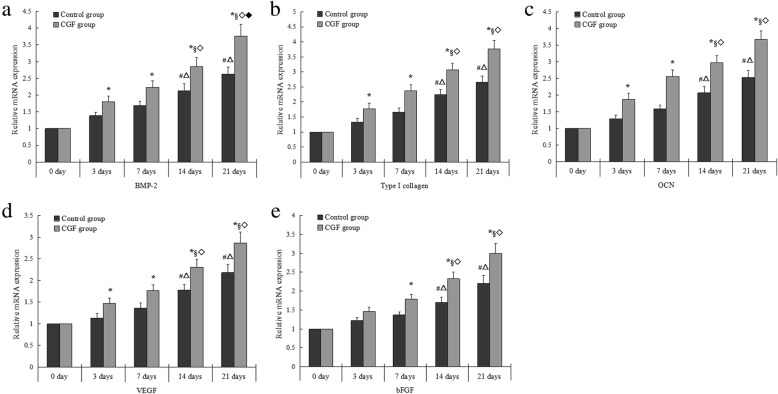
Fig. 7.
The relative mRNA expression of BMP-2 (a), Col-1 (b), OCN (c), VEGF (d), and bFGF (e) in PDCs. *p < 0.05 vs. control group. In control intra-group: #p < 0.05 vs. 3 days; △p < 0.05 vs. 7 days. In CGF intra-group: §p < 0.05 vs. 3 days; ◇p < 0.05 vs. 7 days; ◆p < 0.05 vs. 14 days. mRNA messenger ribonucleic acid, BMP bone morphogenetic protein, Col-1 type I collagen, OCN osteocalcin, VEGF vascular endothelial growth factor, bFGF basic fibroblast growth factor, PDCs periosteum-derived cells. All data were presented as the means ± SD. All experiments were performed independently (each experiment used PDCs and CGF from a different rabbit) and repeated three times

