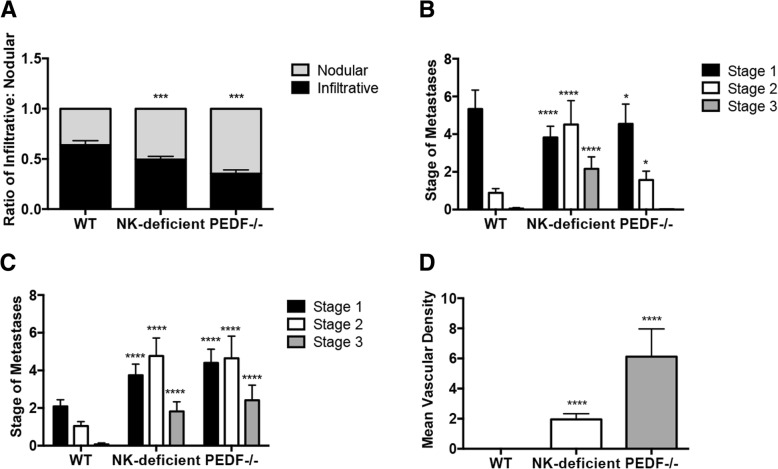
Fig. 2.
Increase in nodular growth in NK depleted and PEDF−/− orthotopic grafts. a The ratio of infiltrative to nodular metastasis was determined from the average number of infiltrative and nodular metastases per mouse. These were then averaged for each group to establish an overall average for each experimental group. NK depleted and PEDF−/− groups were compared to WT using a two-way ANOVA with Tukey’s post-test. Data represents mean ± SEM, ***p < 0.001. Total mice per group: WT: n = 13, NK depleted: n = 17, PEDF−/−: n = 16. b left, NK-depleted group showed a significant increase in the number of stage 2 and 3 infiltrative metastases in comparison to WT and PEDF−/− groups. PEDF−/− group showed a significant increase in the average number of stage 2 infiltrative metastases. Data represents mean ± SEM, ****p < 0.0001 using two-way ANOVA with Tukey’s post-test. b right, NK depleted and PEDF−/− groups showed a significant increase in the average number of stages 2 and 3 nodular metastases compared to WT group. Data represents mean ± SEM, ****p < 0.0001, using two-way ANOVA with Tukey’s post-test. c Representative images of Stages 1–3 of the infiltrative and nodular metastatic growth patterns. Black arrow points at the micrometastases; white arrows depicts the metastatic cells adjacent the portal venule. d Increase in the mean vascular density in the metastatic tissue of NK depleted and PEDF−/− groups compared to WT. MVD calculated as the average of the number of blood vessels per 40x HPF. An area of lumen lined with endothelial cells was considered an individual vessel; tracts and branches were counted as separate vessels. C57BL/6 J, n = 9 mice; C57BL/6 PEDF−/−, n = 9; and C57BL/6 J anti-asialo GM1-treated mice, n = 8. Data represents mean ± SEM, ****p < 0.0001, using one-way ANOVA with Tukey’s post-test

