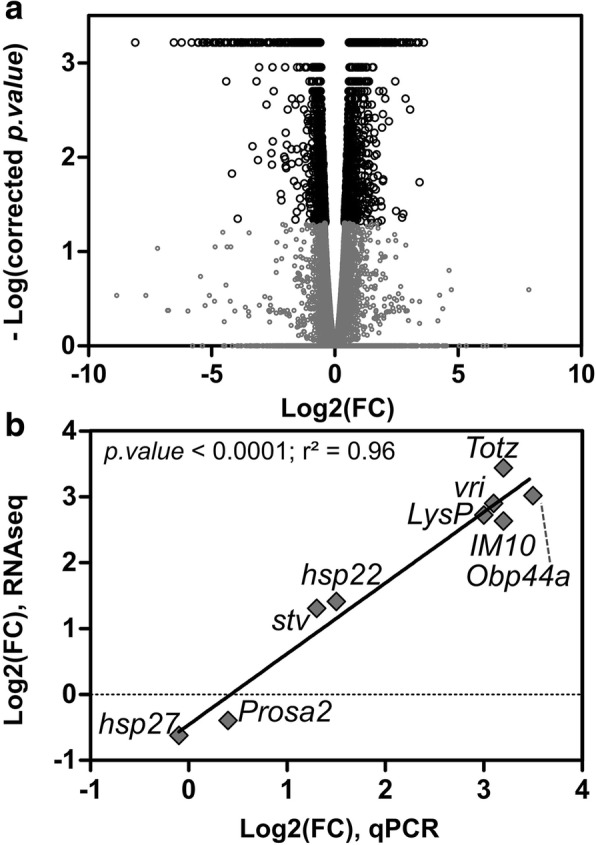
Fig. 2.

(a) Volcano plot of genes expression from RNAseq. Data are plotted as a function of log2 fold change (FC) on X-axis and -log of corrected p.value on Y-axis. Black circles correspond to genes with a corrected p.value < 0.05, and grey circles to genes with a corrected p.value > 0.05. Fold change (FC) was calculated using the ratio of expression acclimated/control, so positive values correspond to upregulation in acclimated flies. (b) Expression values of nine selected genes based on RNAseq (Y-axis) and qPCRs (X-axis). Expressions resulting from both techniques were highly similar resulting in a significant linear relation with a slope not different form 1 (see results)
