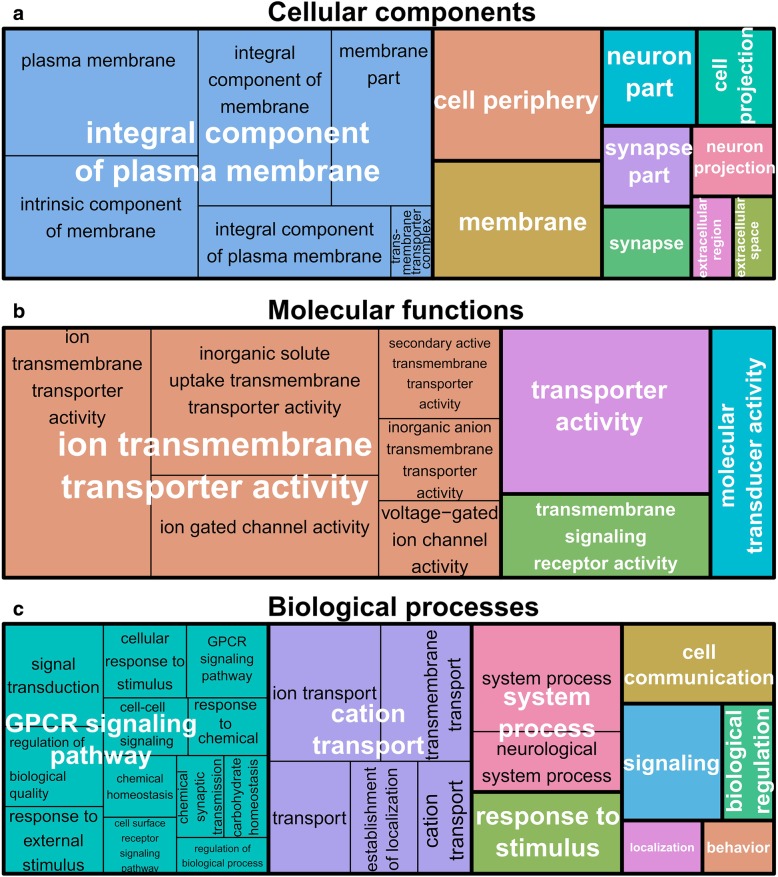
Fig. 3.
Treemap representation from REVIGO of overrepresented GO-terms from upregulated genes in acclimated flies for: (a) cellular components, (b) molecular functions and (c) biological processes. In each treemap, each rectangle represents a significant GO-term. The sizes of rectangles are adjusted to reflect the relative corrected p-value (i.e. the larger the rectangle, the more significantly the GO-term was). Within the treemaps, GO-terms sharing the same color belong to the same GO superclusters whose names are labelled in white

