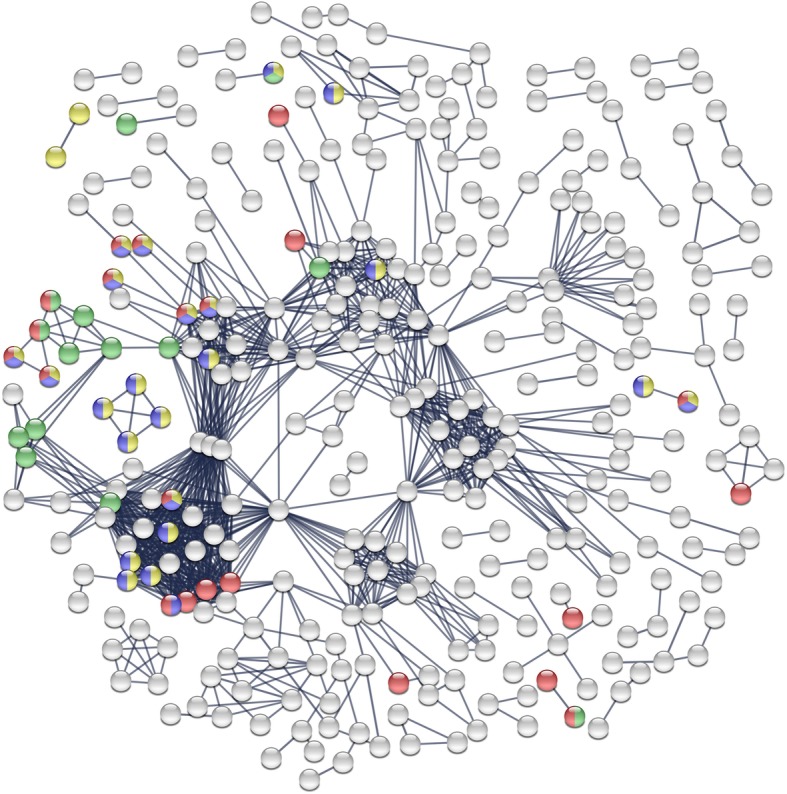
Fig. 5.

Interaction network resulting from the set of upregulated genes in acclimated flies. Each node represents a protein, and each line represents an interaction between two proteins. The gene sets were analyzed for putative protein-protein interactions using STRING program with default settings, with exception of the confidence interactions value that was set to high confidence (score > 0.9). Disconnected nodes are not represented. Genes involved in the major GO superclusters detected in REVIGO (see Fig. 3) are highlighted with different colors: Cellular component: red: ‘integral component of plasma membrane’; Molecular functions: blue: ‘ion transmembrane transporter activity’; Biological processes: yellow: ‘cation transport’; green: ‘GPCR signaling pathway’
