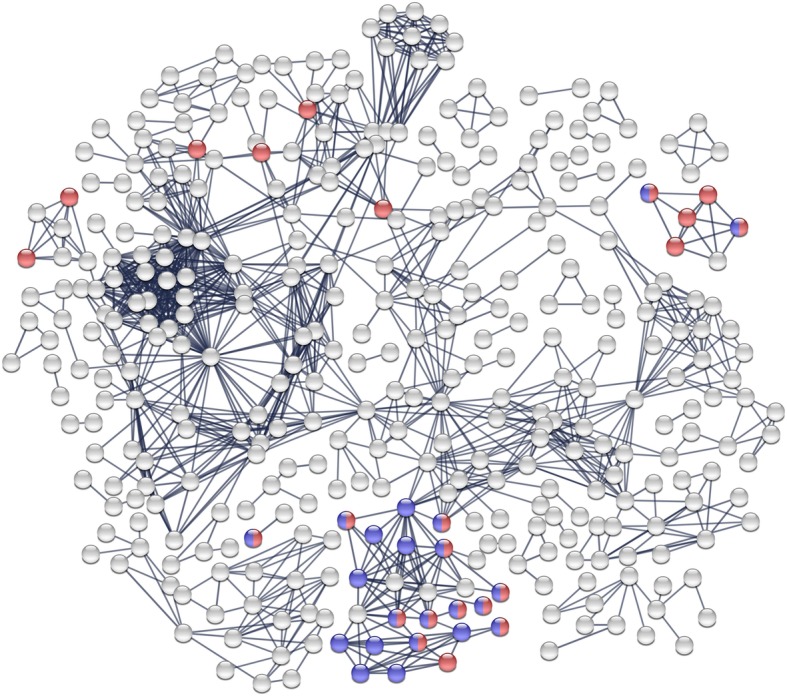
Fig. 6.

Interaction network resulting from the set of down regulated genes in acclimated flies. Each node represents a protein, and each line represents an interaction between two proteins. The gene sets were analyzed for putative protein-protein interactions using STRING program with default settings, but with high confidence interactions value (score > 0.9). Disconnected nodes are not represented here. The thickness of the edges are related to confidence in data (thicker lines indicate stronger evidence for interaction). Genes involved in the major GO superclusters detected in REVIGO (see Fig. 4) are highlighted in color: Cellular component: blue: ‘chorion’; Biological processes: red: ‘chorion-containing eggshell formation’
